YOUR INDICATOR RESEARCH STARTS HERE

Find the right indicator.
Understand what it does.

Explore 11,183 indicators. Filter beyond the obvious.
Discover the tools that fit the way you trade.

THE INDICATOR LIBRARY

Results for “sigmoid”

11,183 tools to explore

11 indicators matching your filters
Save search
MomentumOscillatorSignal

RSI (Kernel Optimized) | Flux Charts

by fluxchart

A specialized RSI indicator using Kernel Density Estimation to predict potential pivot points by analyzing historical RSI patterns and calculating probability of price reversals.

Separate pane · unverifiedScalping · Day Trading
Explore
5.9Klikes98.1Kviews23comments
Save
TrendMomentumEditor’s pick

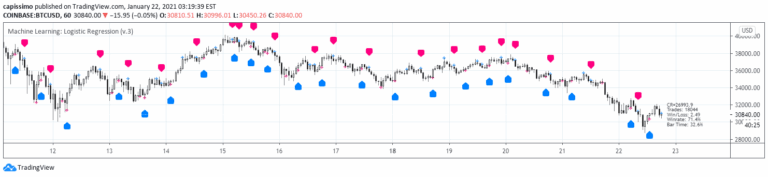
Machine Learning: Logistic Regression

by capissimo

A machine learning strategy using logistic regression to classify market movements into binary categories by fitting a sigmoid curve to predict potential trading directions.

Main price chart · unverifiedDay Trading · Swing Trading
Explore
4.9Klikes153.1Kviews111comments
Save
OscillatorSignalVolume

True Volume

by AlgoRhythmica

An advanced volume analysis tool that measures volume density across multiple assets, providing insights into market maker activities and liquidity concentration in trading markets.

Separate pane · unverifiedScalping · Day Trading
Explore
536likes11.9Kviews8comments
Save
MomentumSignalOscillator

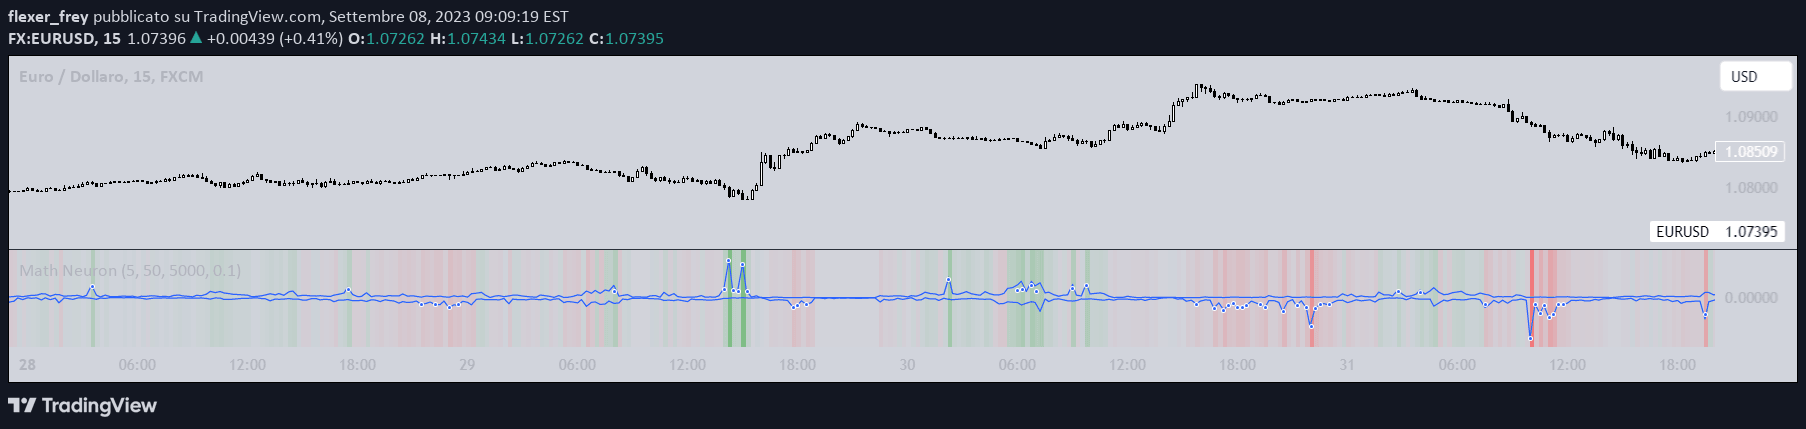
Math Neuron

by flexer_frey

A neural network-based trading signal that uses RSI of close and volume to predict potential pivot highs and lows, employing a two-input neuron with sigmoid activation.

Separate pane · unverifiedScalping · Day Trading
Explore
39likes2.6Kviews7comments
Save
MomentumSignalVolume

Optimized Wavelets

by Cmo22

A high-resolution trading indicator using wavelet transforms to analyze market pressure by combining price and volume data with advanced signal processing techniques.

Separate pane · unverifiedScalping · Day Trading
Explore
39likes1.9Kviews0comments
Save
SignalTrend

Dynamic Gradient Filter

by Mupsje

A dynamic gradient filter that adapts to price movements using sigmoid functions, providing a smoothed representation of market trends with customizable sensitivity.

Main price chart · unverifiedScalping · Day Trading
Explore
33likes1.6Kviews3comments
Save
TrendMomentum

Schaff Trend Cycle (STC)

by mihakralj

The STC indicator is a dynamic momentum oscillator that combines MACD and stochastic techniques to identify market cycles, trend reversals, and potential trading opportunities with enhanced signal filtering.

Separate pane · unverifiedDay Trading · Swing Trading
Explore
32likes975views0comments
Save
OscillatorSignal

Sigmoidal Candle Count Risk (SCCR)

by lord1x

A unique signal measuring potential market reversals by analyzing consecutive candle movements using a sigmoid function to calculate risk probability between bullish and bearish trends.

Separate pane · unverifiedScalping · Day Trading
Explore
12likes1.2Kviews2comments
Save

Likes, views, and comments are historical TradingView snapshots. They describe attention, not trading performance.

START WITH A QUESTION

A little less searching.
A lot more understanding.

Tell DeepAlpha what you need. Get an explanation, a shortlist,
and a direct path to the indicators behind it.

Ask DeepAlpha