Hull Suite
Hull Moving Average (HMA) is an advanced technical indicator designed to minimize lag and provide smooth trend visualization across multiple variants with customizable settings.
Explore 11,183 indicators. Filter beyond the obvious.
Discover the tools that fit the way you trade.
11,183 tools to explore
Hull Moving Average (HMA) is an advanced technical indicator designed to minimize lag and provide smooth trend visualization across multiple variants with customizable settings.
An advanced all-in-one trading strategy builder that combines over 30 indicators to generate custom buy and sell signals across multiple timeframes and trading styles.
Ghost Tangent Crossings is an innovative pivot point indicator that visualizes market movements using ellipses, dynamically tracking zig-zag patterns and potential price breakouts.
A comprehensive market sentiment indicator that synthesizes multiple technical analysis techniques into a single value, providing insights into market direction, momentum, and potential trend reversals.
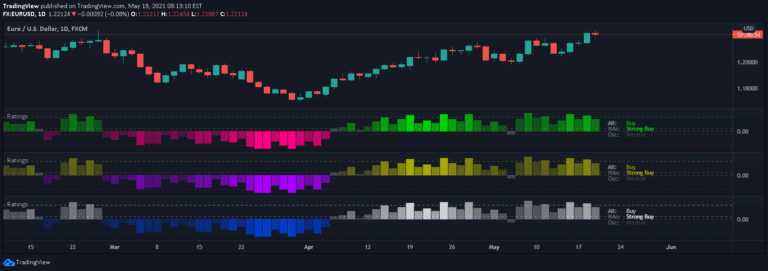
A comprehensive trading signal that aggregates 26 technical indicators into a single rating, evaluating market sentiment through moving averages and oscillators to provide actionable trading insights.
An indicator that identifies divergences between swing points of a chart symbol and two external tickers, providing statistical insights into price behavior correlation.
A sentiment oscillator that measures bullish and bearish market sentiment by analyzing price movements across multiple bars to provide trend and entry/exit signals.
Ichimoku Oscillator is a multi-layered technical analysis tool that evaluates market trends using Ichimoku Cloud features, providing insights into potential entry and exit points.
A real-time trading profile indicator that visualizes volume, price, time, activity, and age across different market levels, providing dynamic insights into trading activity.
A comprehensive divergence analysis tool that calculates divergence strength across multiple indicators, providing a single metric to assess potential market reversals and trend shifts.
An advanced trend channel indicator using pivot points and ATR to estimate trend direction quickly, with integrated candlestick pattern recognition for enhanced trading insights.
Volume Footprint Voids is a trading indicator that uses lower timeframe calculations to plot single candle Point of Control (POC) and identify volume imbalances for precise entry and exit points.
Likes, views, and comments are historical TradingView snapshots. They describe attention, not trading performance.