Linear Regression Channel
A Linear Regression Channel indicator that tracks price trends, identifies channel breakouts, and analyzes momentum direction using dynamic visual signals and customizable settings.
Explore 11,183 indicators. Filter beyond the obvious.
Discover the tools that fit the way you trade.
11,183 tools to explore
A Linear Regression Channel indicator that tracks price trends, identifies channel breakouts, and analyzes momentum direction using dynamic visual signals and customizable settings.
ICT Algorithmic Macro Tracker plots key trading time windows based on Inner Circle Trader methodology, helping traders identify potential market movement periods across specific time intervals.
A multi-level moving average strategy that identifies trend strength by analyzing recursive moving averages across multiple levels, providing insights into market trend direction and potential reversals.
A comprehensive multi-indicator script that displays various technical indicators in separate windows, allowing traders to customize and analyze market momentum, volume, and trend signals.
A configurable higher timeframe indicator that allows visualization of price movement, Fair Value Gaps, and Volume Imbalance across multiple timeframes for strategic trading analysis.
The Standardized SuperTrend Oscillator transforms the SuperTrend indicator into a dynamic tool for analyzing market trends, offering insights into potential reversals and mean reversion opportunities.
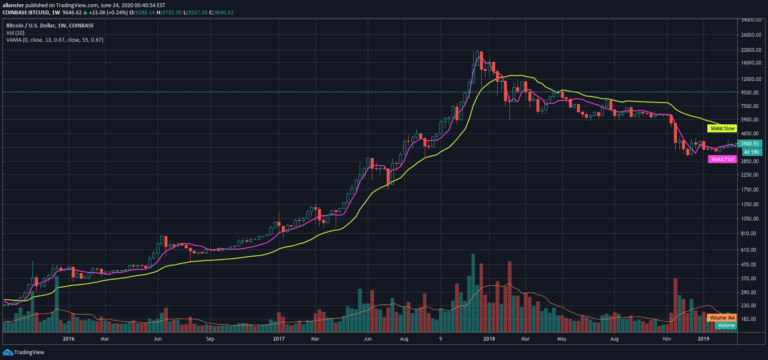
Volume Adjusted Moving Average (VAMA) is an advanced indicator that calculates moving averages based on volume increments rather than traditional time-based methods, offering a unique perspective on price trends.
A Pine Script color gradient generator that enables dynamic color generation for trading indicators, providing flexible visualization techniques for market analysis and signal representation.
A sophisticated trend indicator that uses triple smoothing to filter market noise and identify potential trend directions through moving average crossovers and dynamic color visualization.
A comprehensive TradingView indicator that identifies support and resistance levels using pivot points and volume data, helping traders predict potential market turning points and trading zones.
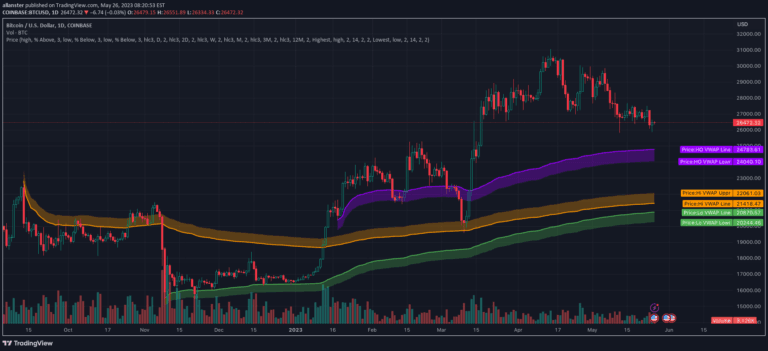
An advanced VWAP toolbox that provides multiple anchored VWAP techniques, including pinch and handoff strategies, periodic intervals, and automatic anchor selection for technical analysis.
A flexible price filtering tool that resamples and analyzes market data using multiple methods and advanced moving average techniques to reduce noise and identify underlying price trends.
Likes, views, and comments are historical TradingView snapshots. They describe attention, not trading performance.