Order Blocks & Breaker Blocks [LuxAlgo]
Order Blocks & Breaker Blocks indicator identifies key price zones where significant trading activity occurred, highlighting potential future trading opportunities based on market structure.
Explore 11,183 indicators. Filter beyond the obvious.
Discover the tools that fit the way you trade.
11,183 tools to explore
Order Blocks & Breaker Blocks indicator identifies key price zones where significant trading activity occurred, highlighting potential future trading opportunities based on market structure.
A multi-indicator divergence script that analyzes divergences across 10 different technical indicators to identify potential trend reversals and price movements.
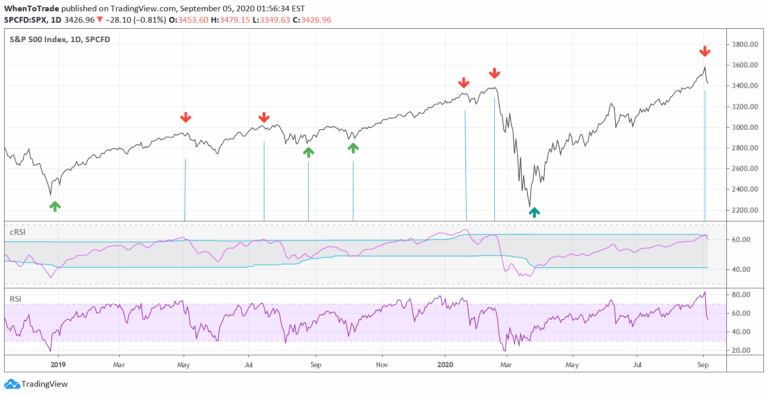
An enhanced RSI indicator that uses cyclic smoothing and adaptive bands to provide more responsive market trend signals by incorporating dominant cycle length.
A trading indicator tracking institutional investor actions by calculating probabilities of market structure changes and order flow direction for strategic trading decisions.
Auto-generated Fibonacci Retracements that identify market structure shifts and potential support/resistance zones based on technical breaks and price action dynamics.
Global Liquidity Index tracks worldwide central bank balance sheets, providing a comprehensive view of global monetary conditions and potential market trends through consolidated financial data.
A predictive indicator that estimates future trading ranges by providing dynamic support and resistance levels while helping traders identify price trend directions in real-time.
A generalized Gaussian filter that smooths price data with variable pole orders, reducing noise and high-frequency market movements using advanced signal processing techniques.
A trading indicator that identifies swing failure patterns by detecting price movements that exceed and then retreat from key swing levels, potentially signaling trend reversals.
A daily indicator identifying supply and demand areas using market data, highlighting potential support and resistance levels based on price and volume interactions.
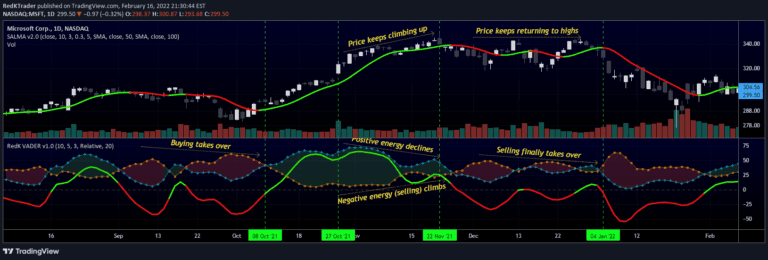
VADER is a volume-based technical indicator that measures market energy by analyzing price displacement and trading volume to determine bullish or bearish market sentiment.
A comprehensive trading signal that identifies and visualizes price gaps, wicks, and market imbalances across multiple timeframes with advanced customization options.
Likes, views, and comments are historical TradingView snapshots. They describe attention, not trading performance.