
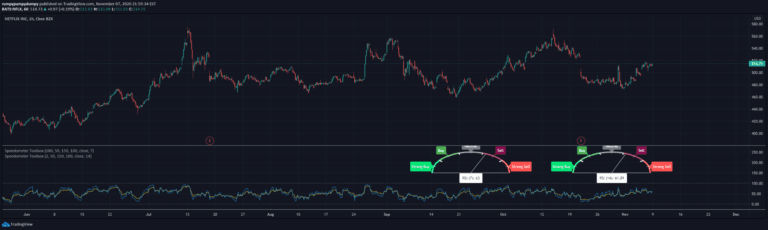
Speedometer Toolbox
Custom metric speedometers provide specialized visualization techniques for tracking and representing performance indicators through graphical gauge-like representations.
Explore 11,183 indicators. Filter beyond the obvious.
Discover the tools that fit the way you trade.
11,183 tools to explore
Custom metric speedometers provide specialized visualization techniques for tracking and representing performance indicators through graphical gauge-like representations.
A custom speedometer visualization tool that converts complex market data like analyst recommendations and put-call ratios into an intuitive graphical representation of market sentiment and trend.
A visual indicator that tracks changes in market volatility through a histogram and average line, helping traders identify volatility speed and potential trading opportunities.
Likes, views, and comments are historical TradingView snapshots. They describe attention, not trading performance.