Volume Profile Volume Delta OI Delta [Kioseff Trading]
A trading indicator that calculates volume delta and open interest delta, providing insights into market sentiment and trading activity across different price levels and asset types.
Explore 11,183 indicators. Filter beyond the obvious.
Discover the tools that fit the way you trade.
11,183 tools to explore
A trading indicator that calculates volume delta and open interest delta, providing insights into market sentiment and trading activity across different price levels and asset types.
A generalized Gaussian filter that smooths price data with variable pole orders, reducing noise and high-frequency market movements using advanced signal processing techniques.
An advanced indicator analyzing open interest flows and price sentiment using Elder-Ray concept to assess market activity, trader positioning, and potential trend dynamics.
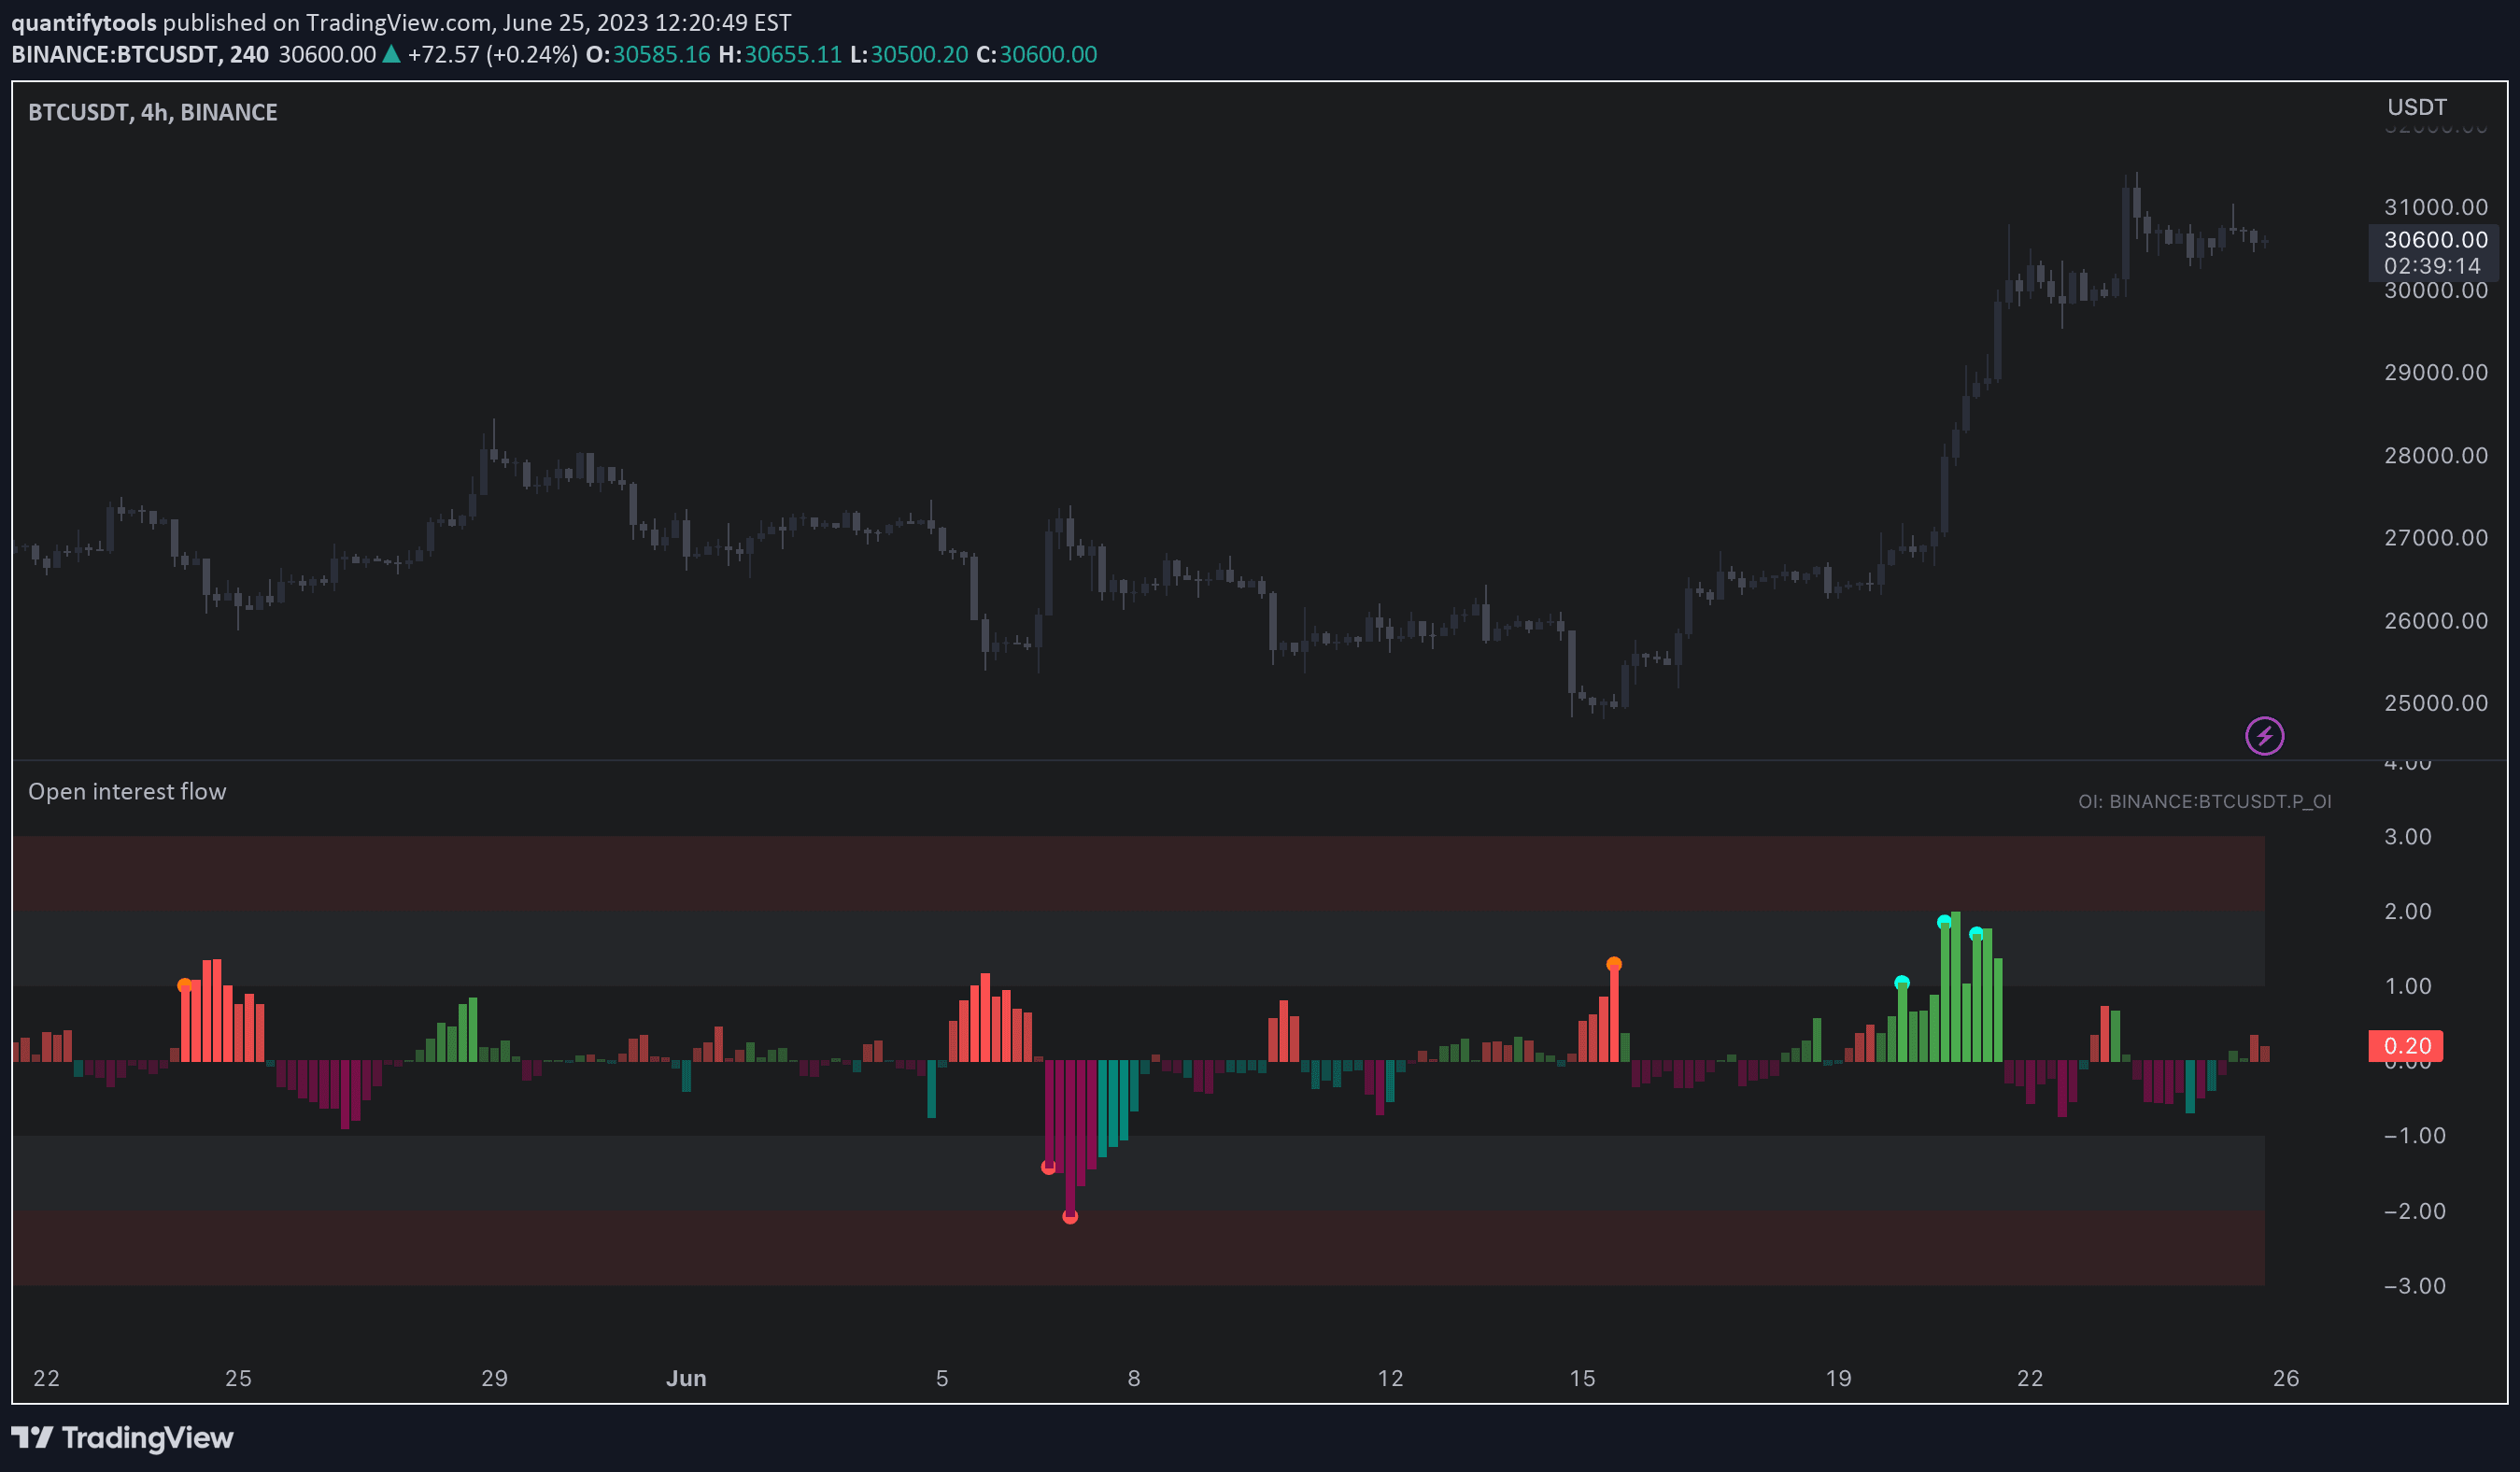
Open interest flow indicator detecting market sentiment by analyzing position openings and closings, revealing potential exuberance or liquidation moments in trading.
A trading indicator combining Double Exponential Moving Average (DEMA) with Relative Strength Index (RSI) to generate responsive trend and momentum signals across different market conditions.
An advanced open interest profile indicator that visualizes price movement and volume trends across different market conditions, using color-coded profiles to highlight price and OI dynamics.
A market range indicator that identifies trading session boundaries and potential daily high/low points using predefined and custom time ranges for traders.
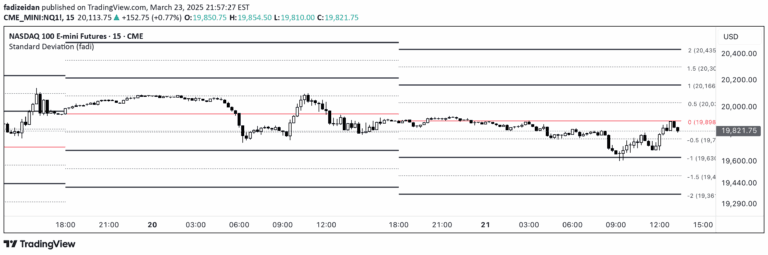
Standard Deviation indicator maps price movements by measuring how far prices deviate from their average, revealing market volatility and potential trend reversals using statistical analysis.
A specialized indicator that calculates open interest across price levels during zig zag trends, providing detailed insights into trading activity and price movement dynamics.
A dynamic heatmap tool that tracks volume and open interest deltas across multiple timeframes, providing visual representation of trading activity and market dynamics.
An advanced trading concept that identifies overnight price gaps in futures markets, using specific time frames and standard deviation projections to analyze potential market movements and liquidity zones.
An advanced moving average overlay that adapts to market volatility using Jurik Volty and TEMA, providing a responsive trend indicator with noise reduction.
Likes, views, and comments are historical TradingView snapshots. They describe attention, not trading performance.