Market Structure Break & Order Block by EmreKb
A market structure break and order block indicator that identifies trend reversals by analyzing price action breakouts and key candle formations to signal potential trading opportunities.
Explore 11,183 indicators. Filter beyond the obvious.
Discover the tools that fit the way you trade.
11,183 tools to explore
A market structure break and order block indicator that identifies trend reversals by analyzing price action breakouts and key candle formations to signal potential trading opportunities.
A machine learning-powered SuperTrend indicator that uses k-means clustering to dynamically adapt to market volatility, providing intelligent trend identification and volatility insights.
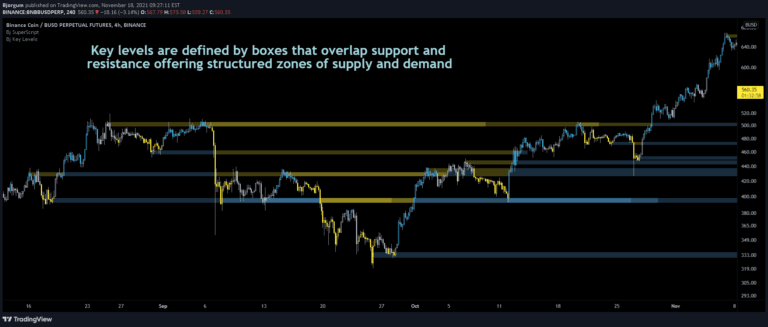
Key Levels strategy identifies critical price action points like breakouts, false breakouts, and backchecks to help traders understand market movement and potential trading opportunities.
Smart Money Concept (SMC) tracks institutional investor movements, identifying key market structure changes, order blocks, and liquidity zones to reveal potential trading opportunities.
A dynamic trend indicator using Zero-Lag Moving Average and EMA to detect market momentum shifts, highlighting trend reversal levels and potential price zones.
Global Liquidity Index tracks worldwide central bank balance sheets, providing a comprehensive view of global monetary conditions and potential market trends through consolidated financial data.
Ghost Tangent Crossings is an innovative pivot point indicator that visualizes market movements using ellipses, dynamically tracking zig-zag patterns and potential price breakouts.
A volume heat map indicator that colors volume bars and candles based on the standard deviation of trading volume from its average. Provides visual insights into volume intensity and potential market significance.
A dynamic breakout trading indicator that identifies market movements through change in character and break of structure patterns, with integrated volume analysis and customizable take profit levels.
A comprehensive market sentiment indicator that synthesizes multiple technical analysis techniques into a single value, providing insights into market direction, momentum, and potential trend reversals.
A pure price action analysis tool that automatically identifies market structures, swing highs and lows, and detects potential trend changes and continuations in real-time trading scenarios.
A trading signal that analyzes price action in relation to volume pressure, providing insights into market trends through volume-based histograms and buy-sell convergence/divergence indicators.
Likes, views, and comments are historical TradingView snapshots. They describe attention, not trading performance.