Relative Volume at Time
A sophisticated relative volume indicator that calculates current volume compared to past volume, offering multiple calculation modes and contextual analysis of trading activity.
Explore 11,183 indicators. Filter beyond the obvious.
Discover the tools that fit the way you trade.
11,183 tools to explore
A sophisticated relative volume indicator that calculates current volume compared to past volume, offering multiple calculation modes and contextual analysis of trading activity.
A trend-following system that uses volatility-scaled steps to track market momentum, visualizing trend progression through discrete channels and adaptive volatility bands.
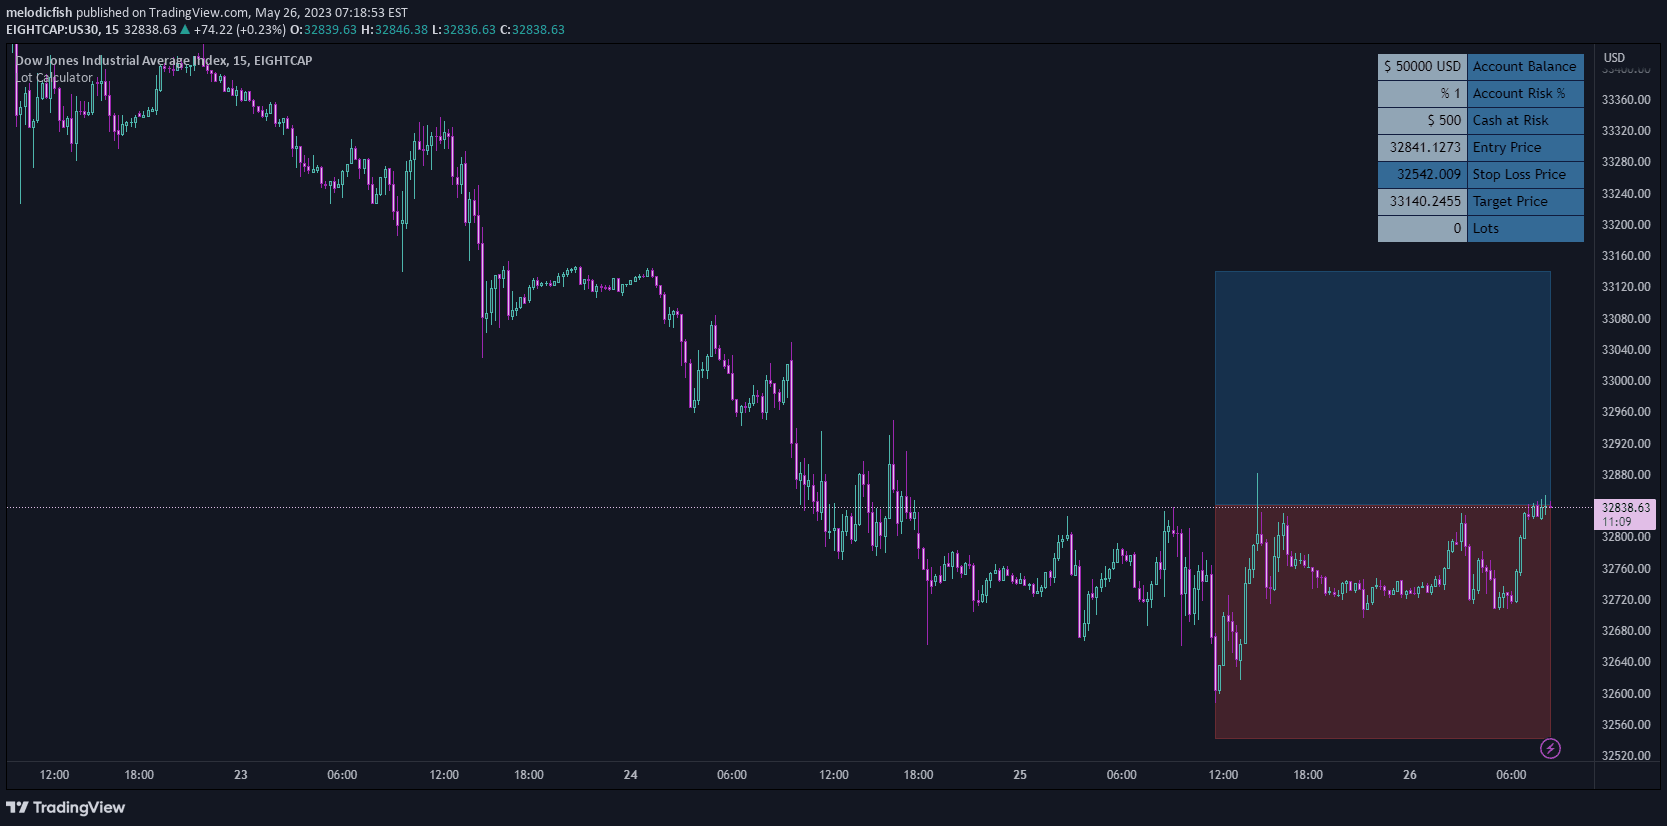
A versatile lot size calculator that helps traders manage risk by dynamically calculating position sizes based on entry, stop levels, account risk, and trading instrument.
Dollar-Cost Averaging (DCA) indicator that compares investing a fixed amount periodically versus a lump sum investment, helping traders analyze long-term investment strategies across different timeframes.
A sophisticated trading indicator combining Savitzky-Golay filter and Z-Score to detect trend shifts, momentum changes, and potential market reversals with statistical precision.
Z-Score SMMA is a dynamic momentum oscillator that normalizes a Smoothed Moving Average using Z-score to detect trend shifts and price deviations across different market conditions.
A trading tool that calculates stop loss and take profit levels, helping traders efficiently manage trades by providing dynamic risk and reward calculations.
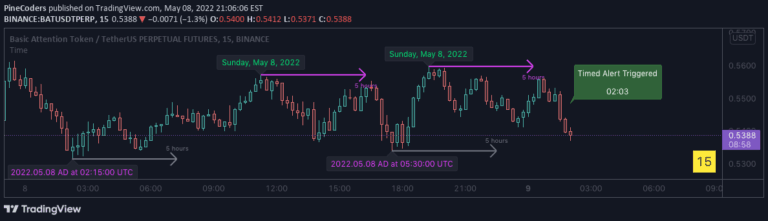
A Pine Script library offering advanced time manipulation functions to format timestamps, calculate time offsets, and convert time units for precise trading analysis and visualization.
A customizable HLOC indicator that allows traders to view multiple timeframe units and lookback periods with configurable line and label settings for enhanced market analysis.
An indicator using 21 EMA and ATR to identify potential reversal points by measuring the distance between current price and the moving average in ATR units.
Z-Score Candle indicator converts price candles into statistical deviations from mean, revealing overbought/oversold conditions and potential price reversals using mathematical support and resistance.
An experimental moving average that buffers price per share using volume dynamics, creating a smooth price movement indicator that adapts to market volume changes.
Likes, views, and comments are historical TradingView snapshots. They describe attention, not trading performance.