Optimized Trend Tracker
Optimized Trend Tracker (OTT) is an advanced indicator designed to identify market trend direction and provide clear buy and sell signals based on price movements relative to the indicator line.
Explore 11,183 indicators. Filter beyond the obvious.
Discover the tools that fit the way you trade.
11,183 tools to explore
Optimized Trend Tracker (OTT) is an advanced indicator designed to identify market trend direction and provide clear buy and sell signals based on price movements relative to the indicator line.
An advanced all-in-one trading strategy builder that combines over 30 indicators to generate custom buy and sell signals across multiple timeframes and trading styles.
A custom ZigZag indicator that identifies market reversals using momentum indicators, providing true pivot points without repainting and highlighting impulse strength.
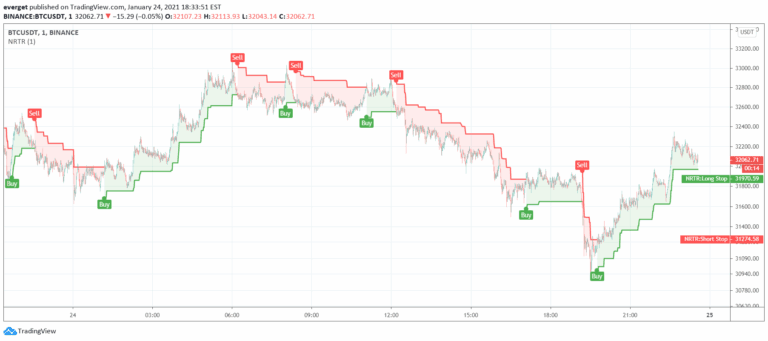
Nick Rypock Trend Reversal (NRTR) is a dynamic price channel indicator that tracks trend direction by measuring price extremes and percentage deviation from peak or bottom.
Volume Delta Candles analyze intrabar trading activity by comparing buy and sell volumes, providing visual insights into price movement and trading sentiment within each candle.
An advanced trading indicator that detects instantaneously mitigated fair value gaps, providing signals based on rapid price corrections and market imbalances.
HARSI is a unique oscillator combining Heikin Ashi candles with RSI calculations, designed to reduce noise and provide smoother trend analysis for traders.
A dynamic trend-following indicator that uses Variable Index Dynamic Average to adapt to market volatility, providing insights into price movements and volume pressure.
A comprehensive hourly trading system that plots key price levels, identifies trend direction, and highlights potential entry and exit points across different timeframes.
The RMI Trend Sniper is a sophisticated trend-following indicator that combines RSI and MFI to generate momentum signals and identify potential market trend reversals.
A volume heat map indicator that colors volume bars and candles based on the standard deviation of trading volume from its average. Provides visual insights into volume intensity and potential market significance.
Live Economic Calendar tracks global financial news events, providing real-time updates on market-moving events across multiple currencies with impact levels and detailed visualizations.
Likes, views, and comments are historical TradingView snapshots. They describe attention, not trading performance.