Colorful Moving Averages
Colorful Moving Averages is an advanced indicator that visualizes price momentum through color-coded moving averages, revealing trend direction, momentum, and acceleration in a single view.
Explore 11,183 indicators. Filter beyond the obvious.
Discover the tools that fit the way you trade.
11,183 tools to explore
Colorful Moving Averages is an advanced indicator that visualizes price momentum through color-coded moving averages, revealing trend direction, momentum, and acceleration in a single view.
The Coppock Curve is a momentum oscillator that identifies potential market reversals and buying opportunities by measuring long-term price momentum using rate of change and weighted moving average.
An advanced technical analysis tool that assesses market risk and trend strength using complex weighted algorithms and multi-layered risk metrics across different market conditions.
A multi-dimensional trading indicator that analyzes price dynamics through weighted moving averages, support/resistance levels, and trend identification markers to help traders spot potential market opportunities.
Dynamic support and resistance indicator that identifies key market levels using historical price action, touch count analysis, and weighted moving averages for strategic trading decisions.
A technical analysis tool using three Weighted Moving Averages to identify market trends, highlight trend transitions, and generate buy/sell signals with enhanced visual clarity.
A comprehensive technical analysis tool combining weighted moving averages, ATR bands, and CCI to identify trend changes, momentum shifts, and potential trading opportunities across different market conditions.
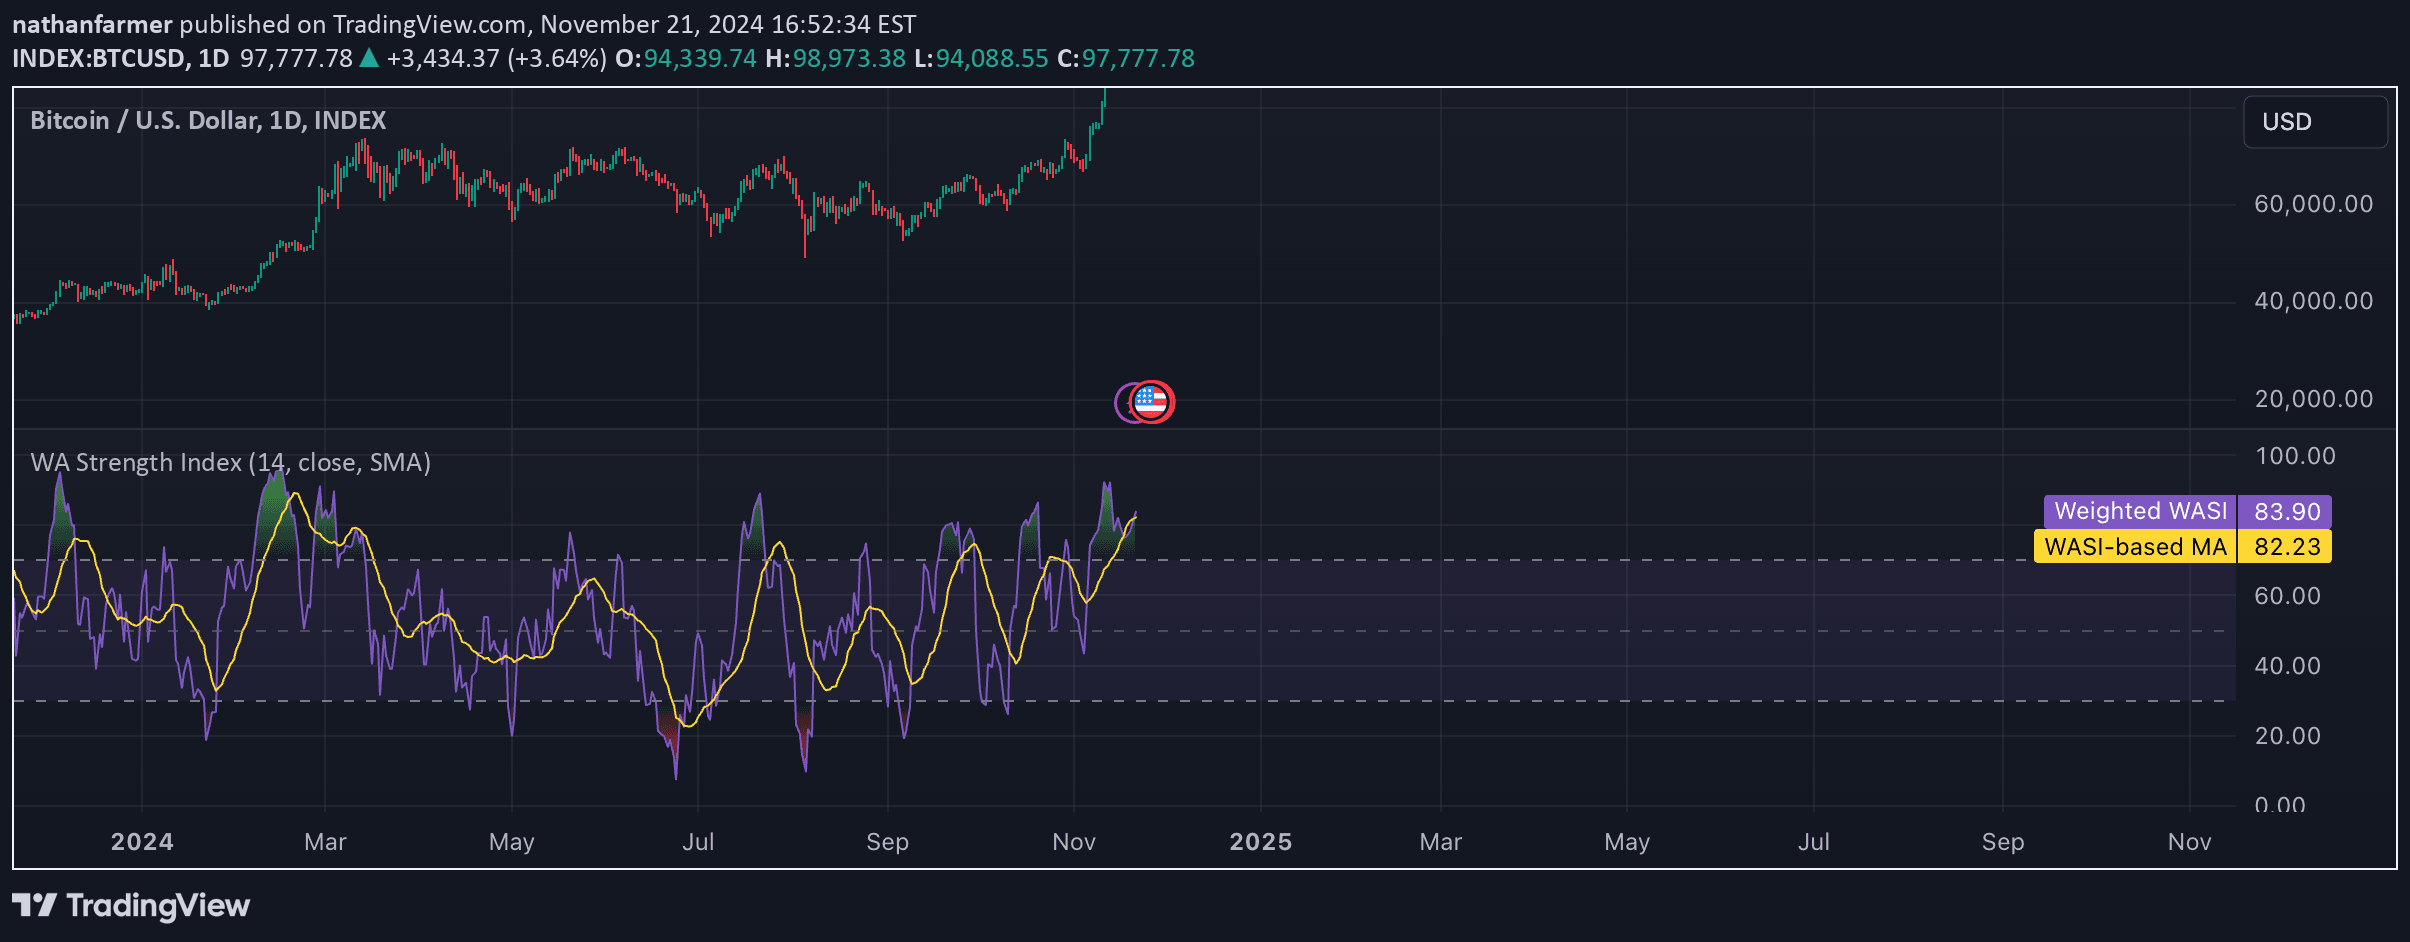
The Weighted Average Strength Index (WASI) is a momentum oscillator that uses weighted moving average to analyze price changes and identify potential trend shifts and trading opportunities.
A trend indicator using two Weighted Moving Averages that visually displays market direction through color-coded ribbons and provides real-time alerts for trend changes.
Likes, views, and comments are historical TradingView snapshots. They describe attention, not trading performance.