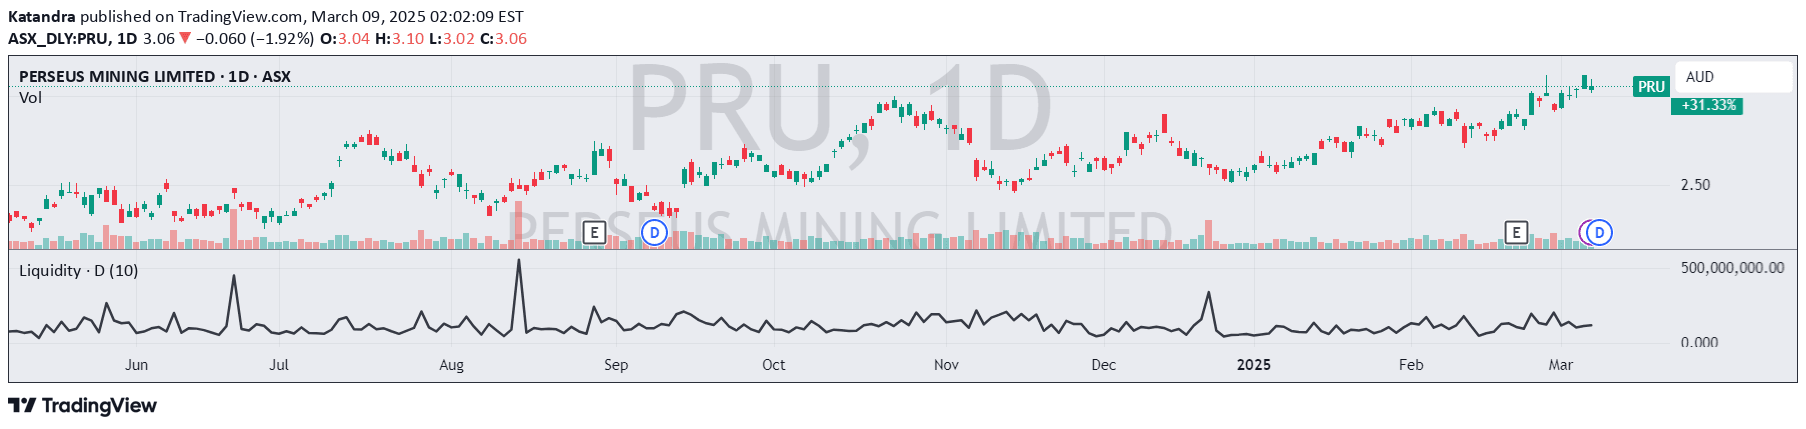
A comprehensive volume analysis indicator that tracks intraday volume relative to historical averages and market benchmarks, providing traders with detailed insights into trading activity.
Explore complementary indicator rolesHow it works
The indicator calculates Cumulative Relative Volume by tracking volume throughout the trading day and comparing it to historical session averages. It compares the stock's volume against the SPY to determine Real Relative Volume, providing a market-relative perspective on trading activity.
The system includes a configurable moving average for volume and displays volume in abbreviated format. Color-coded volume bars and relative volume metrics help traders quickly interpret market dynamics, with visual indicators highlighting whether current volume exceeds or falls below average trading levels.
Why it may be useful
Volume analysis helps traders understand market participation and potential price movements by revealing the strength behind price action. By comparing current volume to historical and market averages, traders can gain insights into potential trend confirmations or reversals.
The color-coded and abbreviated display allows for rapid assessment of trading activity, making it easier to identify significant volume shifts that might indicate important market events or potential trading opportunities.
When to explore it
This volume indicator is most effective for intraday trading strategies, particularly during active market hours when volume trends can provide meaningful insights. It works best for stocks with consistent trading activity and when used in conjunction with price action analysis.
Traders should be cautious about using this indicator on timeframes above daily, as its cumulative volume calculations are designed specifically for intraday analysis. It is particularly useful for identifying unusual volume activity that might signal potential trend changes or breakout opportunities.
Keep exploring
What we’ve verified
Access, alerts and repainting behaviour have not been independently verified for this indicator. Check the creator’s current publication and settings.
General descriptions and classifications are recovered research. Verified details above identify the specific checks we have completed. Check the creator’s current publication for later changes.