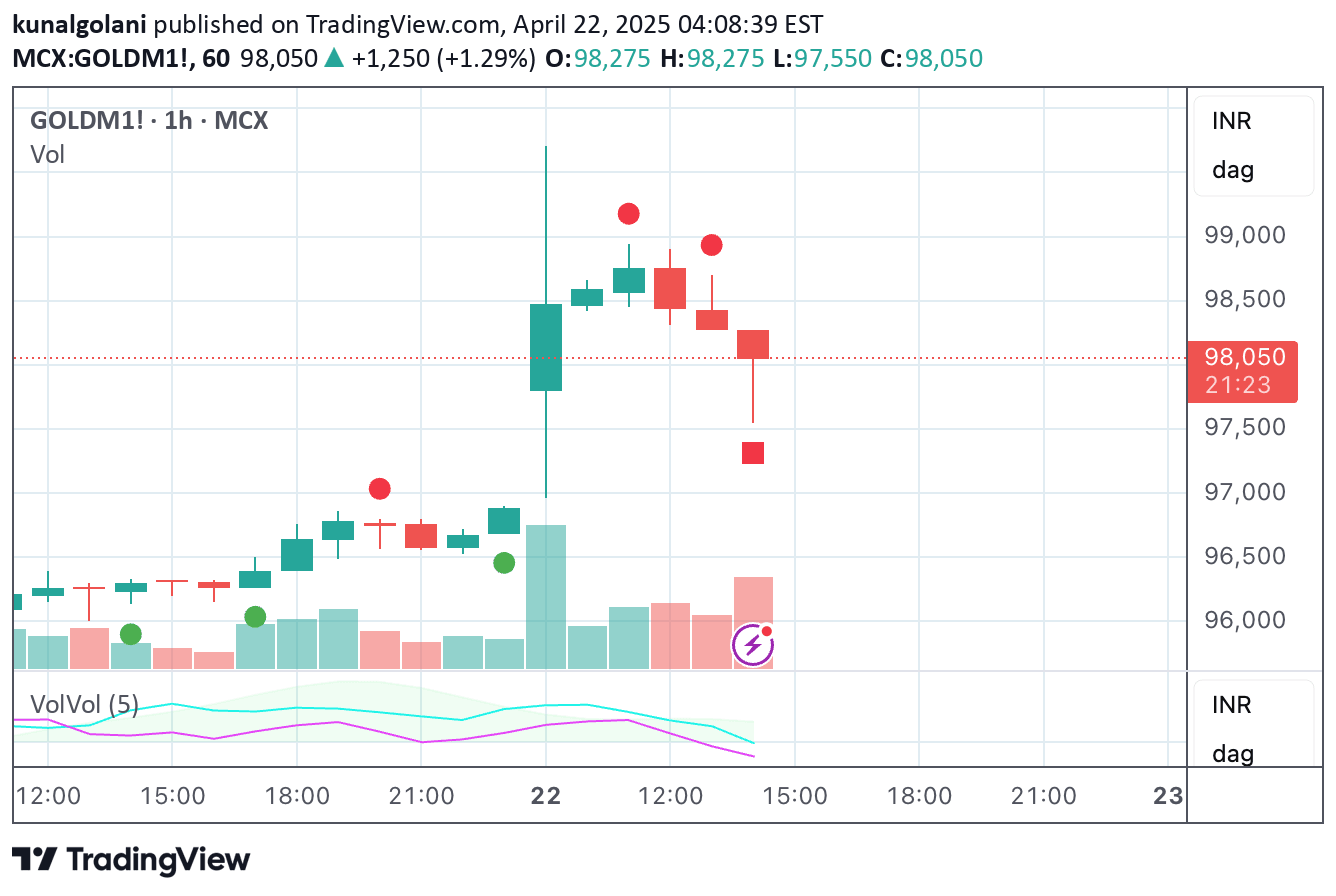
A volume analysis technique that compares current trading volume to its historical average, revealing volume intensity and potential market movements through relative volume visualization.
Explore complementary indicator rolesHow it works
The indicator calculates relative volume by dividing current volume by its 10-period simple moving average, creating a normalized representation of volume intensity. When the result is 1, volume matches the historical average; values below 1 indicate lower volume, while values above 1 show increased trading activity.
Relative volume is plotted as columns with horizontal reference levels at 1, 2, and 3 to help traders quickly understand volume magnitude. Consecutive rising or falling relative volume columns are displayed in the same color, making pattern recognition more intuitive.
Why it may be useful
Relative volume provides traders with a dynamic perspective on market participation and potential trend strength beyond traditional volume analysis. By normalizing volume against its historical average, traders can more easily detect unusual trading activity that might signal important market movements.
This visualization helps identify potential trend confirmations, reversals, and momentum shifts by highlighting periods of significantly increased or decreased trading volume. It offers insights into market sentiment and trader enthusiasm that raw volume numbers might obscure.
When to explore it
Relative volume is most effective during periods of market transitions, such as potential trend reversals or breakouts where volume can provide critical confirmation signals. Traders can use this technique across various timeframes to understand how volume patterns change and potentially predict future price movements.
The indicator is particularly useful for identifying unusual volume spikes, analyzing volume consistency in trending or ranging markets, and detecting potential shifts in market dynamics. It works best when combined with other technical analysis tools to validate potential trading opportunities.
Keep exploring
What we’ve verified
Access, alerts and repainting behaviour have not been independently verified for this indicator. Check the creator’s current publication and settings.
General descriptions and classifications are recovered research. Verified details above identify the specific checks we have completed. Check the creator’s current publication for later changes.