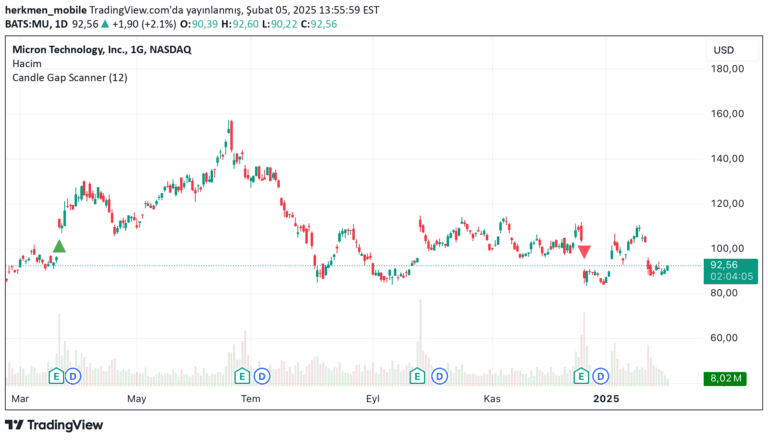
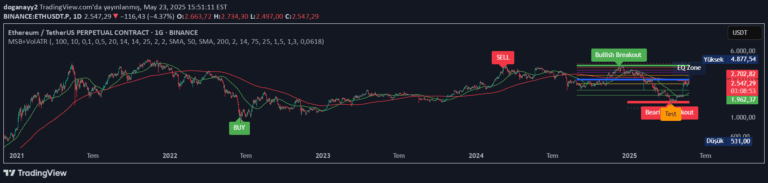
A custom indicator for XAUUSD that identifies and marks candles with a body size of 20 pips or more, helping traders spot significant price movements and momentum shifts.
Explore complementary indicator rolesHow it works
The indicator uses a custom algorithm to calculate the body size of each candle in XAUUSD trading. It specifically measures the price movement by comparing the opening and closing prices, with a focus on identifying candles that exceed a 20-pip threshold.
When a candle meets the 20-pip criteria, the script automatically marks it with a green visual indicator above the candle. Additionally, it plots a blue line tracking candle body sizes and a red dotted line representing the 20-pip threshold for easy reference and analysis.
Why it may be useful
This indicator provides traders with a visual tool to quickly identify significant price movements in the gold market. By highlighting candles with substantial body sizes, it helps traders recognize potential momentum shifts and important market dynamics that might otherwise go unnoticed.
The visual markers and supplementary lines make it easier for traders to spot high-momentum candles, which can be crucial for making informed trading decisions. It transforms complex price action data into an easily digestible format that can support more strategic trading approaches.
When to explore it
The indicator is most effective during periods of active gold market trading, particularly during major economic events or times of high market volatility. Traders can use it to identify potential entry and exit points based on significant price movements.
It is particularly useful for momentum traders who want to quickly assess market strength and direction. The tool can help traders recognize potential trend reversals, breakouts, or consolidation periods by providing a clear visual representation of price action dynamics.
Keep exploring
What we’ve verified
Access, alerts and repainting behaviour have not been independently verified for this indicator. Check the creator’s current publication and settings.
General descriptions and classifications are recovered research. Verified details above identify the specific checks we have completed. Check the creator’s current publication for later changes.