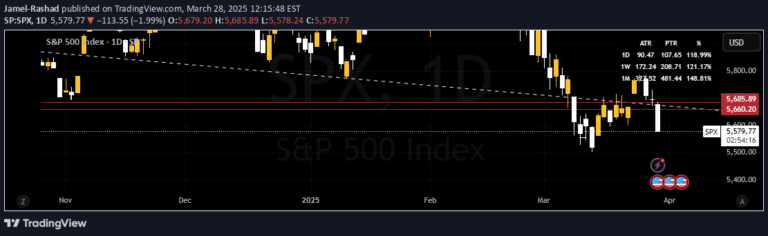
ADX and EMA combine to assess trend strength and direction, helping traders identify potential entry and exit points by measuring momentum and recent price movements.
Explore complementary indicator rolesHow it works
The Average Directional Index (ADX) measures trend strength by analyzing positive and negative directional indicators. It calculates the momentum of price movement, providing a numerical value that represents the trend's intensity, regardless of its direction.
The 14-period Exponential Moving Average (EMA) tracks recent price movements by giving more weight to recent closing prices. By smoothing out price data, the EMA helps traders identify the current trend direction and potential trend changes more responsively than traditional simple moving averages.
Why it may be useful
Combining ADX and EMA provides traders with a comprehensive view of market dynamics by offering insights into both trend strength and direction. This dual approach helps reduce the likelihood of entering trades during weak or choppy market conditions, potentially improving trading decision-making.
The indicator helps traders filter out low-probability trades and focus on more reliable market movements. By understanding both the momentum and recent price trends, traders can make more informed decisions about potential entry and exit points, ultimately enhancing their risk management strategies.
When to explore it
This signal works best in trending markets where price movements show clear directional momentum. Traders should look for ADX values above 25, indicating a strong trend, and use the EMA to confirm the trend's direction, making it particularly effective in forex, stocks, and commodity markets.
The strategy is most suitable during periods of sustained market movement, such as during major economic announcements, earnings reports, or significant geopolitical events. Traders should avoid using this signal during periods of low volatility or when market conditions appear uncertain and lacking clear directional signals.
Keep exploring
What we’ve verified
Access, alerts and repainting behaviour have not been independently verified for this indicator. Check the creator’s current publication and settings.
General descriptions and classifications are recovered research. Verified details above identify the specific checks we have completed. Check the creator’s current publication for later changes.