
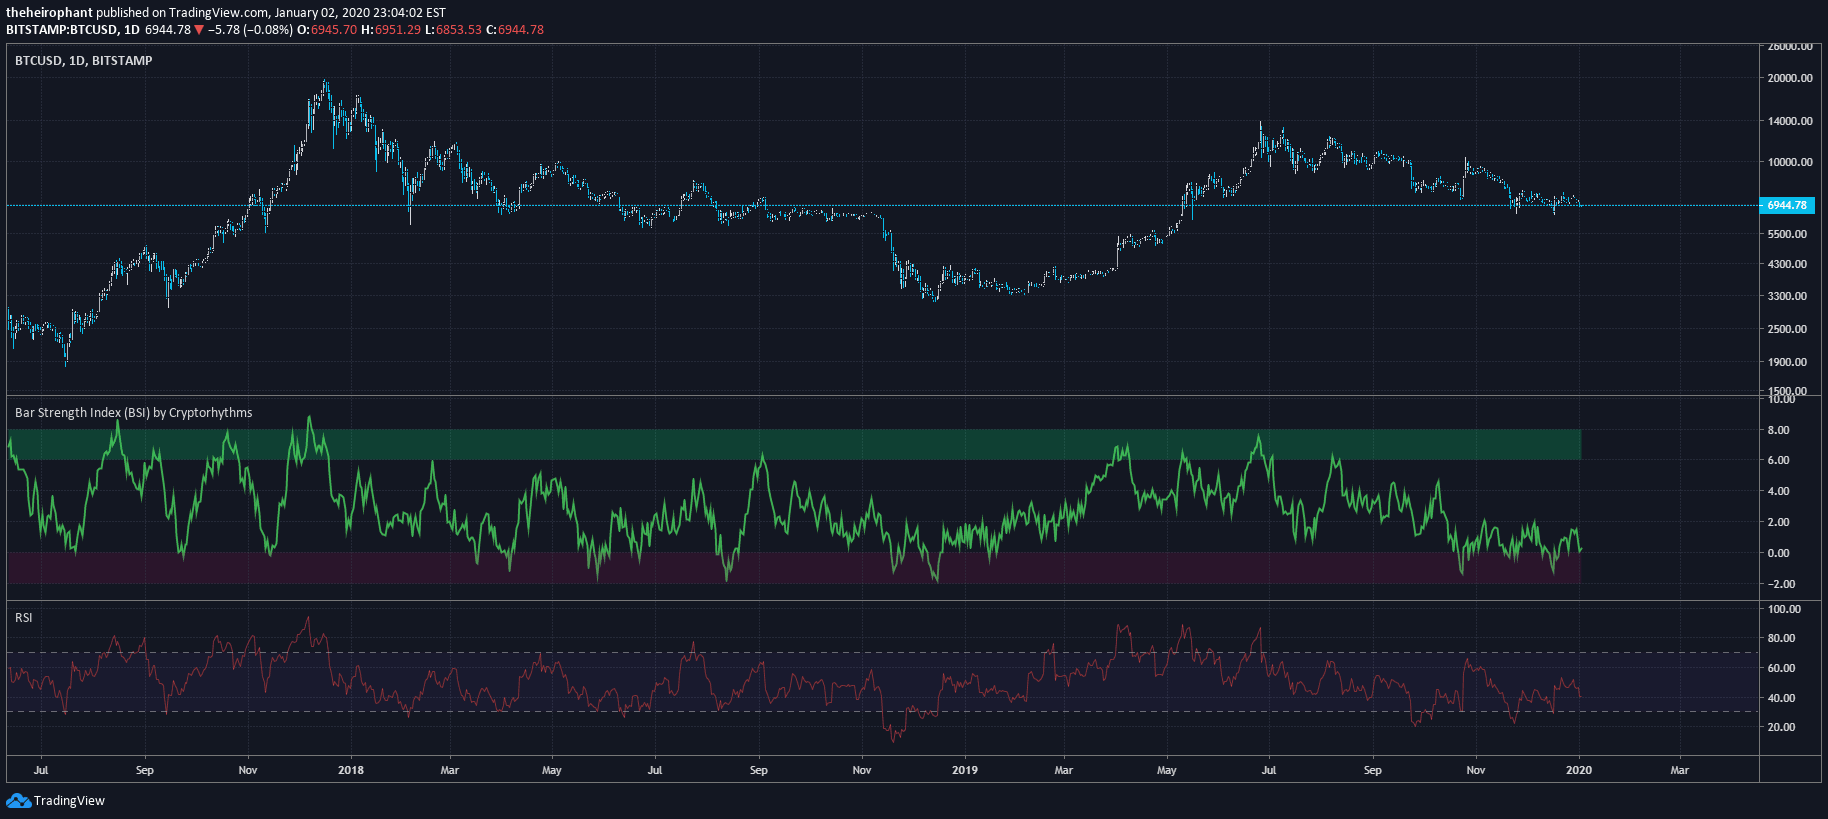
Bar Strength Index (BSI) is a unique momentum indicator derived from Internal Bar Strength, offering insights into price movement and potential trend shifts similar to RSI but with a different calculation method.
Explore complementary indicator rolesHow it works
The Bar Strength Index calculates Internal Bar Strength by determining the relative position of the closing price within a price bar. It uses the formula: IBS = (close - low) / (high - low) * 100. The indicator can be smoothed and scaled adaptively or statically.
It offers normalization options to create a bounded oscillator, making it easier to use for alerts and algorithmic trading. Users can select moving average types and lengths to generate a signal line
Why it may be useful
BSI provides traders with a unique perspective on price momentum and potential trend reversals. Unlike traditional RSI, its distinct calculation method can offer different insights into market dynamics.
The indicator's flexibility allows traders to customize its display and sensitivity. By providing smoothing, scaling, and normalization options, BSI can help identify overbought and oversold conditions more effectively than standard momentum indicators
When to explore it
Bar Strength Index works best on higher timeframes such as daily, weekly, or monthly charts. It is particularly useful for swing traders looking to identify potential trend shifts and momentum changes. The indicator is most effective in markets with clear trending characteristics. Traders should use BSI in conjunction with other technical analysis tools to confirm signals and reduce false positives
Keep exploring
What we’ve verified
Access, alerts and repainting behaviour have not been independently verified for this indicator. Check the creator’s current publication and settings.
General descriptions and classifications are recovered research. Verified details above identify the specific checks we have completed. Check the creator’s current publication for later changes.



