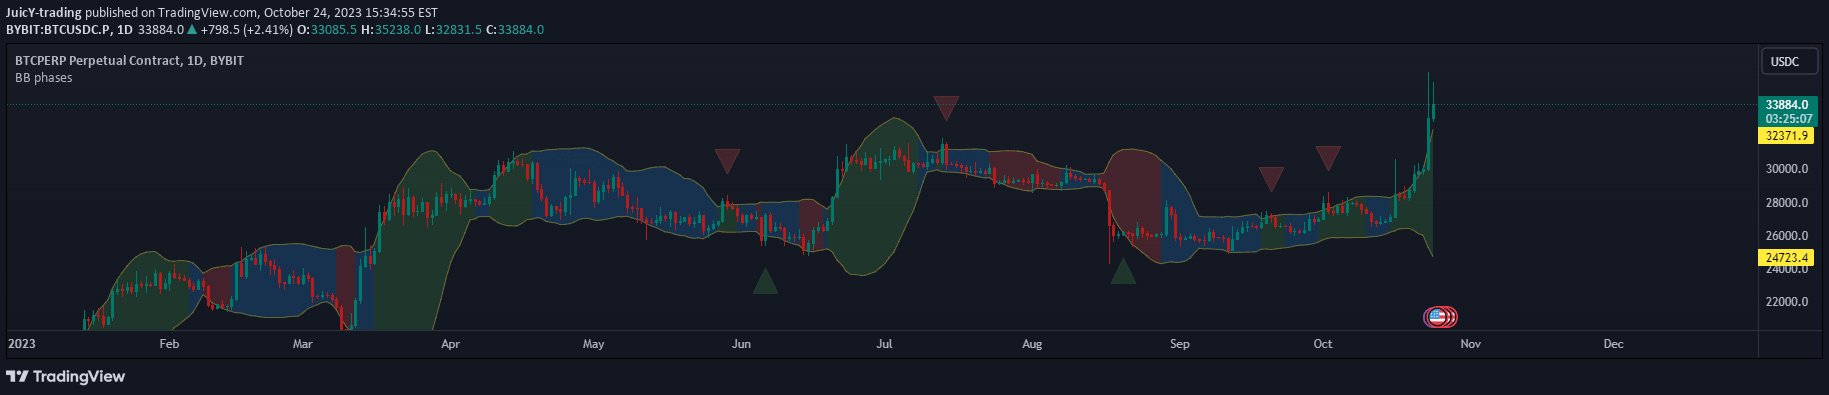
A Bollinger Bands-based indicator that identifies market phases by tracking price movements relative to band boundaries, highlighting squeeze, bullish, and bearish market conditions.
Explore complementary indicator rolesHow it works
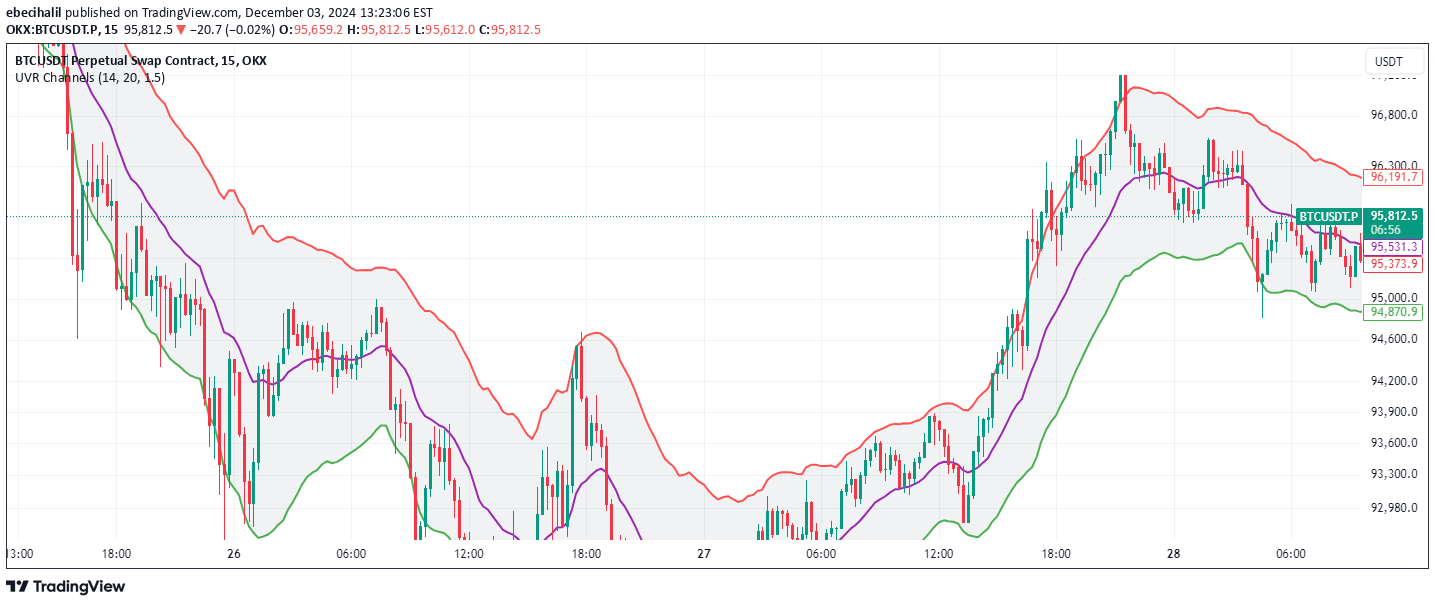
The indicator utilizes Bollinger Bands to dynamically track market phases by analyzing price positions relative to upper, middle, and lower band boundaries. It starts in a 'squeeze' phase when price is contained within the bands, which represents a period of low volatility and potential upcoming price movement.
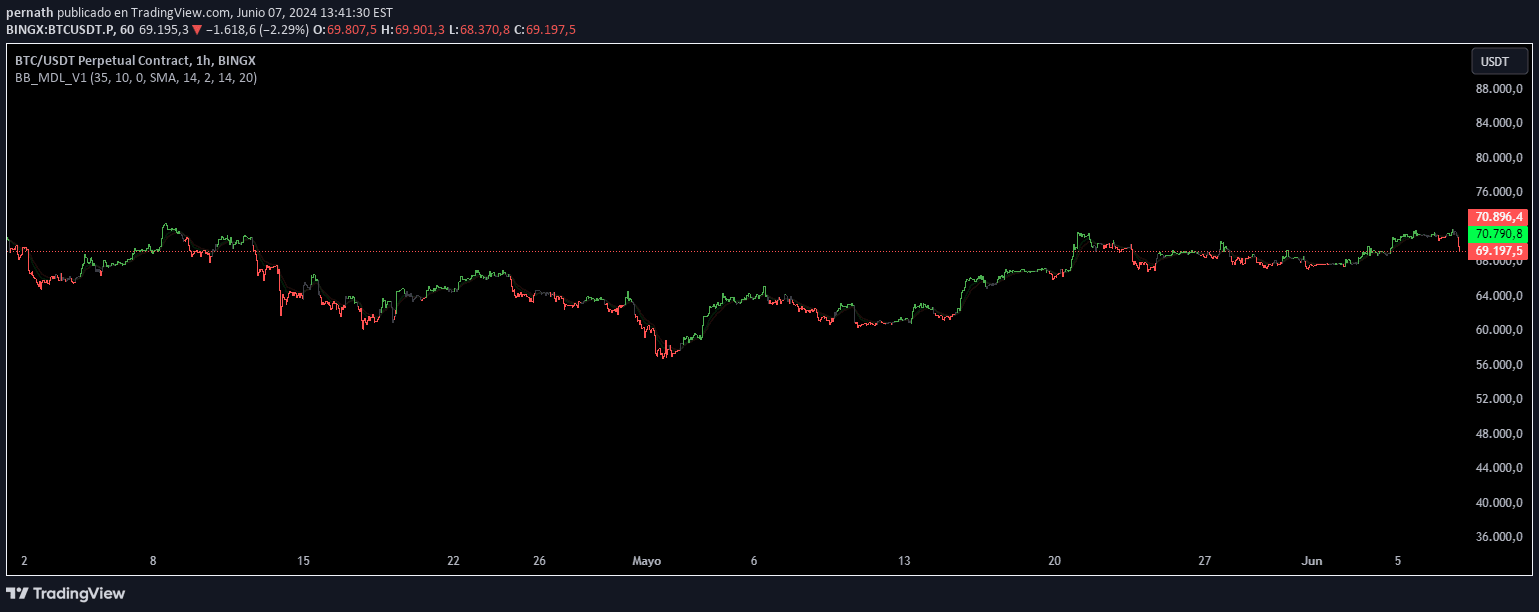
When price breaks above the upper Bollinger Band, the indicator transitions to a bullish phase, signaling potential upward momentum. Conversely, when price drops below the lower Bollinger Band, it shifts to a bearish phase, indicating potential downward price action. The phase continues until price crosses back over the middle band, providing traders with clear visual signals about market dynamics.
Why it may be useful
This indicator helps traders understand market volatility and potential trend changes by providing a structured framework for interpreting price movements through Bollinger Bands. By identifying different market phases, traders can make more informed decisions about potential entry and exit points, reducing emotional trading and providing a systematic approach to market analysis.
The visual representation of market phases allows traders to quickly assess market conditions, recognize potential trend reversals, and adapt their trading strategies accordingly. By tracking how price interacts with Bollinger Bands, traders can gain insights into market momentum and potential breakout opportunities.
When to explore it
The indicator works best in markets with clear trending characteristics and moderate volatility, where price movements consistently interact with Bollinger Bands. It is particularly effective for traders seeking to identify potential trend reversals and momentum shifts in different timeframes, especially for short to medium-term trading strategies.
Traders should use this indicator in conjunction with other technical analysis tools to confirm signals and reduce false positives. It is most reliable in liquid markets with consistent price movements, such as major currency pairs, stock indices, and popular commodities where price tends to respect technical boundaries.
Keep exploring
What we’ve verified
Access, alerts and repainting behaviour have not been independently verified for this indicator. Check the creator’s current publication and settings.
General descriptions and classifications are recovered research. Verified details above identify the specific checks we have completed. Check the creator’s current publication for later changes.