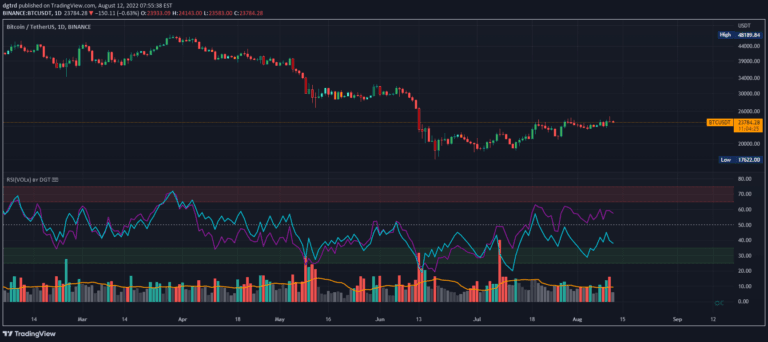
BASS Indicator is a multi-histogram trading signal that visualizes market sentiment and volume dynamics, combining several oscillators to provide a comprehensive view of market strength and potential trend direction.
Explore complementary indicator rolesHow it works
The BASS Indicator combines multiple technical oscillators into a single visualization, including MACD Histogram, RSI Histogram, Slow Stochastic Histogram, Awesome Oscillator, and Alligator Oscillator.
Each histogram is color-coded, with blue bars above zero indicating positive sentiment and red bars below zero showing negative sentiment. The purple volume bias bars are calculated by subtracting the 30-period Volume-Weighted Moving Average from the 30-period Simple Moving Average, providing additional insight into market momentum
Why it may be useful
This indicator is crucial for traders because it consolidates multiple technical analysis tools into a single, easy-to-read panel. By integrating different oscillators, it provides a more comprehensive view of market dynamics than individual indicators.
Traders can quickly assess market sentiment, potential trend reversals, and volume strength. The combination of different oscillators helps reduce false signals and provides a more robust analysis of market conditions
When to explore it
The BASS Indicator works best in markets with clear trending or ranging conditions. It is particularly effective when used alongside other technical analysis tools like Alligator, MACD, or Moving Average lines.
Traders should pay special attention when blue and red bars are present simultaneously, indicating a potential battle between bulls and bears. The volume bias bars are especially useful for confirming trend strength and potential price movements
Keep exploring
What we’ve verified
Access, alerts and repainting behaviour have not been independently verified for this indicator. Check the creator’s current publication and settings.
General descriptions and classifications are recovered research. Verified details above identify the specific checks we have completed. Check the creator’s current publication for later changes.