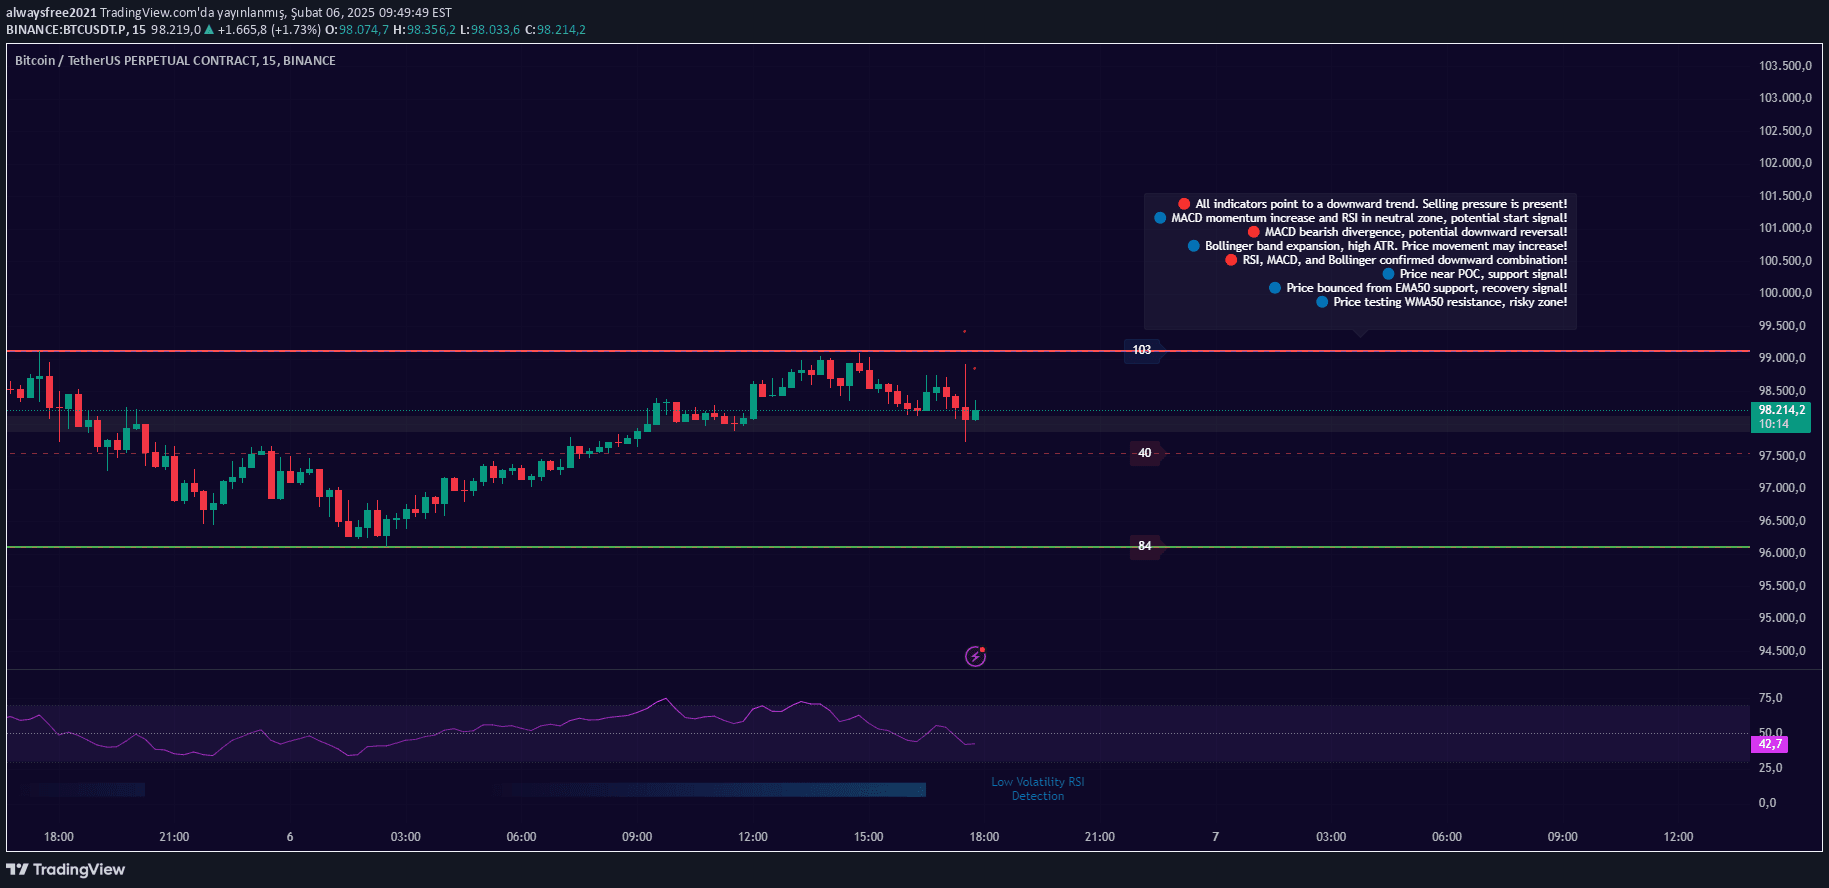
A trading indicator that highlights significant price movements by identifying candles with price changes exceeding a user-defined threshold, helping traders spot potential big-money market moments.
Explore complementary indicator rolesHow it works
The Big Money indicator calculates the price change for each bar by comparing the close and open prices against a user-defined threshold. When a candle's price movement meets or exceeds this threshold, the script automatically triggers visual highlighting mechanisms to draw attention to the significant price action.
The script implements three key visual elements to emphasize these moments: changing the bar color to yellow, drawing a semi-transparent yellow box around the highlighted candle, and adding a 'BigMoney' label above the bar. This dynamic box extends to subsequent bars, creating a continuous zone of interest for traders to analyze potential significant market movements.
Why it may be useful
The Big Money indicator provides traders with an intuitive visual tool to quickly identify potentially significant price movements in the market. By highlighting candles that demonstrate substantial price changes, it helps traders focus their attention on moments where substantial market activity might be occurring, potentially indicating shifts in market sentiment or momentum.
This approach allows traders to quickly scan charts and recognize areas where 'big money' might be entering or exiting positions. The customizable threshold and clear visual markers make it easier for traders to spot and interpret important price action without getting overwhelmed by complex technical analysis.
When to explore it
The Big Money indicator is most effective in markets with clear, directional price movements and when traders want to quickly identify significant price changes. It works particularly well for active trading styles like scalping and day trading, where rapid identification of price momentum is crucial for making timely trading decisions.
Traders should adjust the threshold based on the specific characteristics of the financial instrument and timeframe they are trading. In more volatile markets, a higher threshold can help filter out minor price fluctuations, while in less volatile markets, a lower threshold might reveal more nuanced price movements.
Keep exploring
What we’ve verified
Access, alerts and repainting behaviour have not been independently verified for this indicator. Check the creator’s current publication and settings.
General descriptions and classifications are recovered research. Verified details above identify the specific checks we have completed. Check the creator’s current publication for later changes.