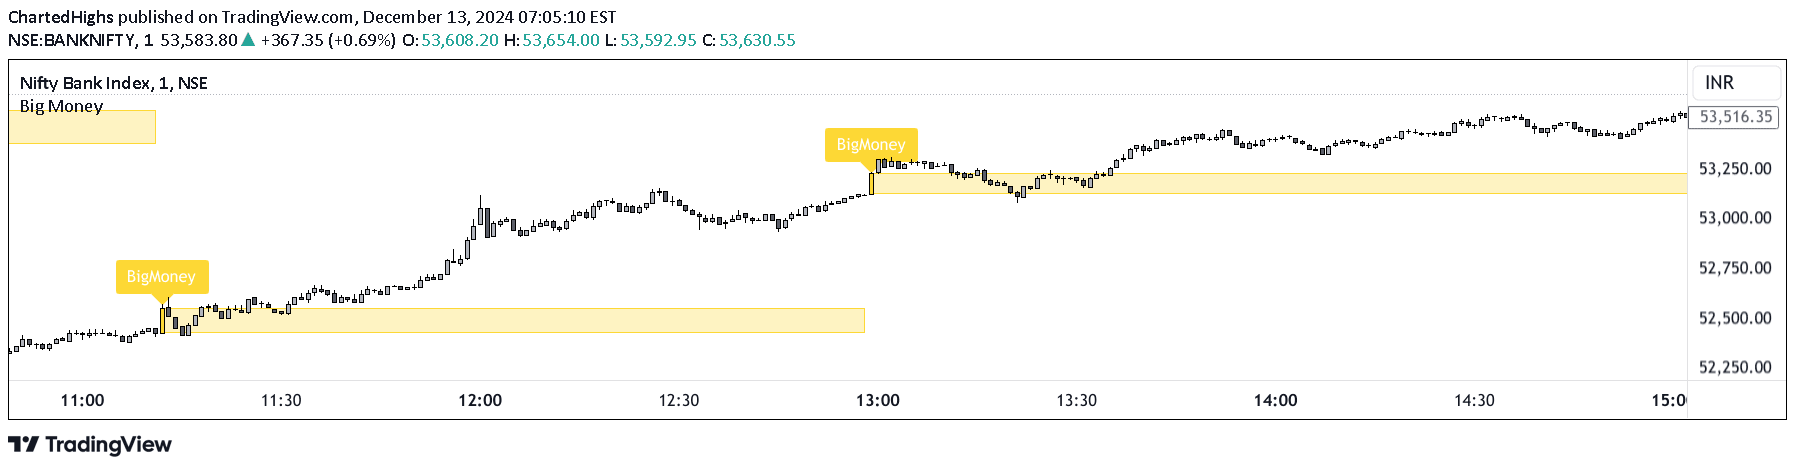
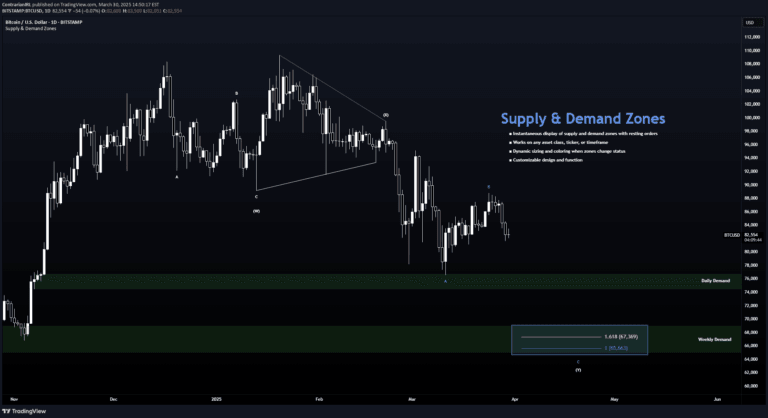
A technical indicator that identifies areas of strong buying and selling pressure by calculating price deltas and using standard deviation to highlight significant market activity zones.
Explore complementary indicator rolesHow it works
The Delta Zones indicator calculates price differences using various combinations of open, close, high, and low prices to determine market pressure. It applies a user-defined standard deviation threshold to identify significant buying and selling zones, which are then visually represented as colored boxes on the price chart.
When the calculated delta exceeds the specified standard deviation, the indicator generates visual signals. Green boxes indicate strong buying pressure, suggesting potential long entry points, while red boxes represent strong selling pressure, signaling potential short entry opportunities.
Why it may be useful
The Delta Zones indicator provides traders with a unique visual representation of market dynamics, helping them understand the underlying buying and selling pressures that might not be immediately apparent from price action alone. By highlighting areas of intense market activity, traders can gain insights into potential trend reversals, momentum shifts, and critical support or resistance zones.
This tool allows traders to make more informed decisions by offering a clear, graphical interpretation of market sentiment. It transforms complex price data into easily recognizable signals, enabling traders to quickly assess market conditions and potential trading opportunities across different timeframes.
When to explore it
The Delta Zones Buy/Sell Pressure Indicator is most effective when used in conjunction with other technical analysis tools and within the context of broader market trends. It works best in markets with clear directional movements and significant price volatility, where distinct buying and selling pressures can be more easily identified.
Traders should consider using this indicator during periods of market transition, such as when price is approaching key support or resistance levels, or when there are potential trend reversal signals. It is particularly useful for traders seeking to confirm market sentiment and identify potential entry and exit points across various financial instruments and timeframes.
Keep exploring
What we’ve verified
Access, alerts and repainting behaviour have not been independently verified for this indicator. Check the creator’s current publication and settings.
General descriptions and classifications are recovered research. Verified details above identify the specific checks we have completed. Check the creator’s current publication for later changes.