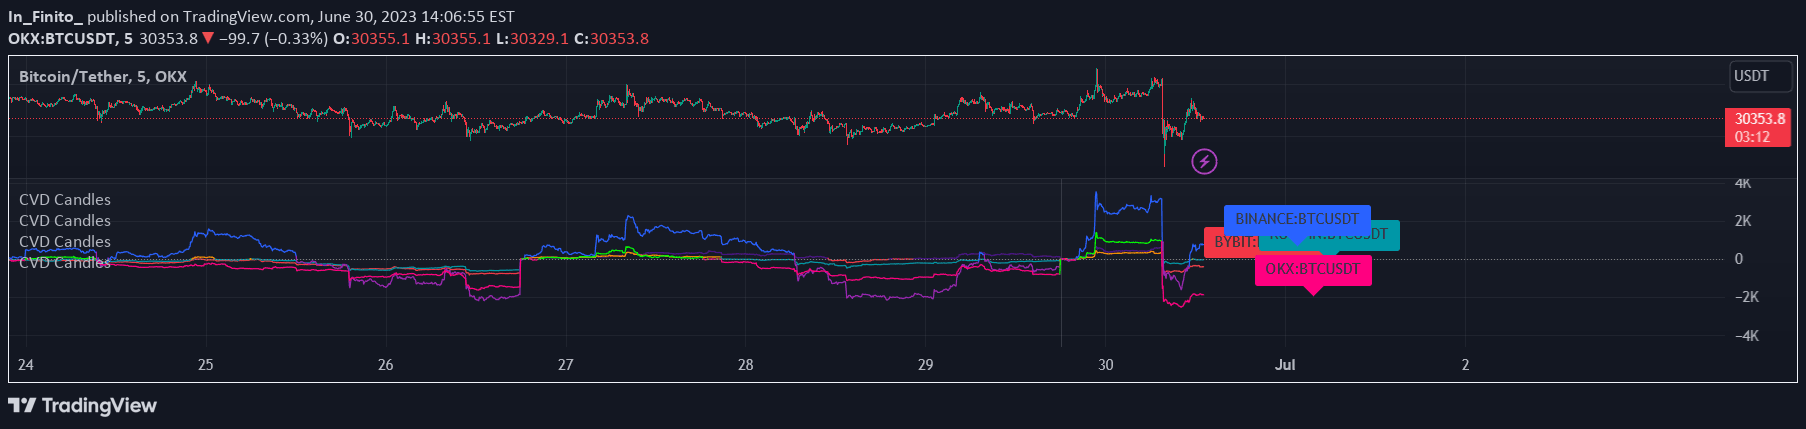
The VOLD Ratio Histogram Indicator analyzes buying and selling volume dominance, providing visual insights into market pressure and potential trend movements.
Explore complementary indicator rolesHow it works
The VOLD Ratio Histogram works by comparing buying and selling volumes over a specific period. Green bars indicate stronger buying volume, while red bars show stronger selling volume. The zero line represents a balanced volume state.
Traders can adjust the period length to control the indicator's sensitivity. Shorter periods provide more responsive signals, while longer periods offer smoother trend indications. The histogram tracks volume pressure by showing the relative strength of buyers and sellers in the market
Why it may be useful
This indicator matters because it provides traders with a visual representation of market sentiment and volume dynamics. By revealing the underlying buying and selling pressure, traders can gain insights into potential trend strength and reversals.
The histogram helps identify accumulation and distribution phases, offering a deeper understanding of market movements. It can confirm existing trends, detect potential trend changes, and highlight significant volume shifts that might not be apparent from price action alone
When to explore it
The VOLD Ratio Histogram is most effective when used in markets with reliable volume data, such as cryptocurrencies and stocks. It works best when combined with other technical indicators for confirmation. Traders should use it to validate trend strength, identify potential reversals, and detect volume surges.
It is particularly useful during trending markets and when looking for early signs of trend exhaustion. The indicator can be applied across different trading styles, from short-term day trading to longer-term swing trading
Keep exploring
What we’ve verified
Access, alerts and repainting behaviour have not been independently verified for this indicator. Check the creator’s current publication and settings.
General descriptions and classifications are recovered research. Verified details above identify the specific checks we have completed. Check the creator’s current publication for later changes.