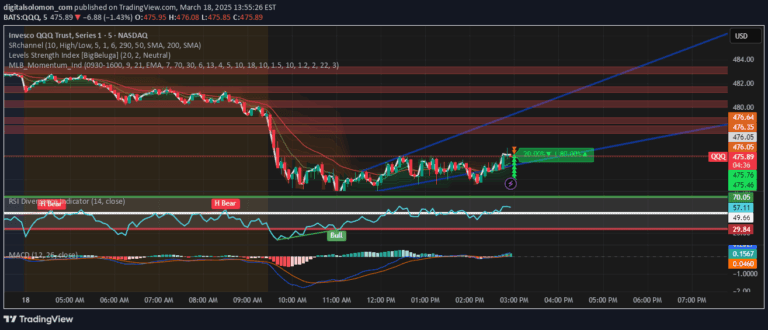
The Twisted Pair indicator uses multiple moving average types to analyze market dynamics and identify trend movements through interlinked price and volume calculations.
Explore complementary indicator rolesHow it works
The Twisted Pair indicator operates by calculating complex market rhythm through multiple moving average techniques, including EMA, DEMA, and TEMA. It creates interconnected lines that track price and volume movements, generating a dynamic market analysis tool.
The indicator uses different computational methods to smooth price data and reveal underlying market trends. By interweaving multiple calculation techniques, it creates a nuanced view of market behavior, allowing traders to understand subtle price fluctuations and potential trend changes.
Why it may be useful
The Twisted Pair indicator provides traders with a sophisticated method of understanding market dynamics beyond traditional single-metric analysis. It offers a comprehensive view of market movements by integrating multiple computational techniques and considering both price and volume data.
By presenting market trends as an intricate dance, the indicator helps traders visualize complex market interactions. Its unique approach allows for more intuitive understanding of market rhythms, helping traders make more informed decisions in varying market conditions.
When to explore it
The Twisted Pair indicator works best during periods of market transition and when seeking to identify potential trend changes. It is particularly effective in markets with moderate volatility, where subtle price movements can indicate significant shifts in market sentiment.
Traders should utilize this indicator when looking for nuanced market insights that go beyond simple trend identification. It is most valuable when combined with other technical analysis tools and when traders are seeking a more holistic understanding of market dynamics.
Keep exploring
What we’ve verified
Access, alerts and repainting behaviour have not been independently verified for this indicator. Check the creator’s current publication and settings.
General descriptions and classifications are recovered research. Verified details above identify the specific checks we have completed. Check the creator’s current publication for later changes.