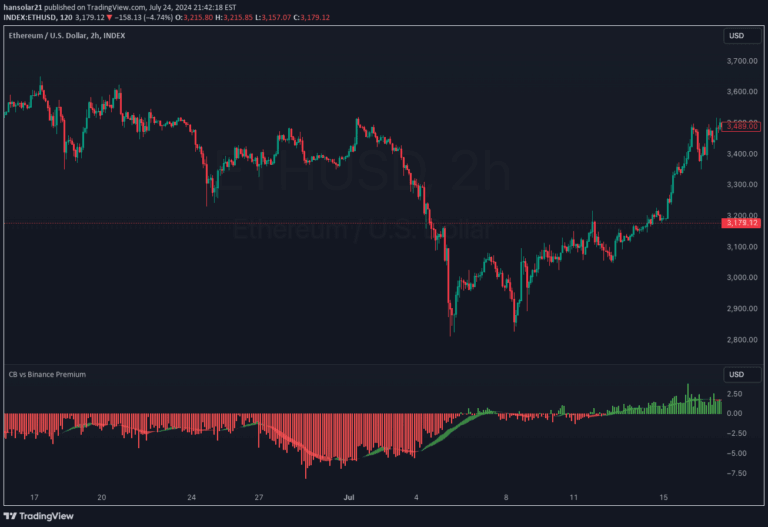
A trading indicator that calculates real-time price differences between Bitfinex and Coinbase for Bitcoin, offering visual insights into potential arbitrage opportunities.
Explore complementary indicator rolesHow it works
The BTC Price Percentage Difference Histogram Indicator operates by simultaneously retrieving Bitcoin prices from Bitfinex and Coinbase exchanges. It calculates the percentage difference between these two prices in real-time, creating a dynamic visualization through a color-coded histogram.
The histogram uses green bars to represent instances where Bitfinex prices are higher than Coinbase, and red bars to indicate when Bitfinex prices are lower. This visual representation allows traders to quickly identify price discrepancies and potential arbitrage opportunities without complex manual calculations.
Why it may be useful
This indicator provides traders with a unique perspective on market dynamics by highlighting price variations between two major cryptocurrency exchanges. By tracking the price differences, traders can gain insights into potential arbitrage opportunities and understand the sentiment of large market participants known as 'Bitfinex whales'.
The real-time nature of the indicator enables quick decision-making, helping traders capitalize on short-term price disparities. It also offers a window into the trading behaviors of influential market players, which can provide valuable context for trading strategies.
When to explore it
The BTC Price Percentage Difference Histogram Indicator is most effective during periods of high market volatility and when trading Bitcoin across multiple exchanges. It is particularly useful for traders looking to exploit short-term price differences and those interested in understanding broader market movements.
Traders should use this indicator in conjunction with other technical analysis tools to validate potential trading opportunities. It is especially valuable during times of significant market uncertainty or when large traders might be making substantial moves.
Keep exploring
What we’ve verified
Access, alerts and repainting behaviour have not been independently verified for this indicator. Check the creator’s current publication and settings.
General descriptions and classifications are recovered research. Verified details above identify the specific checks we have completed. Check the creator’s current publication for later changes.