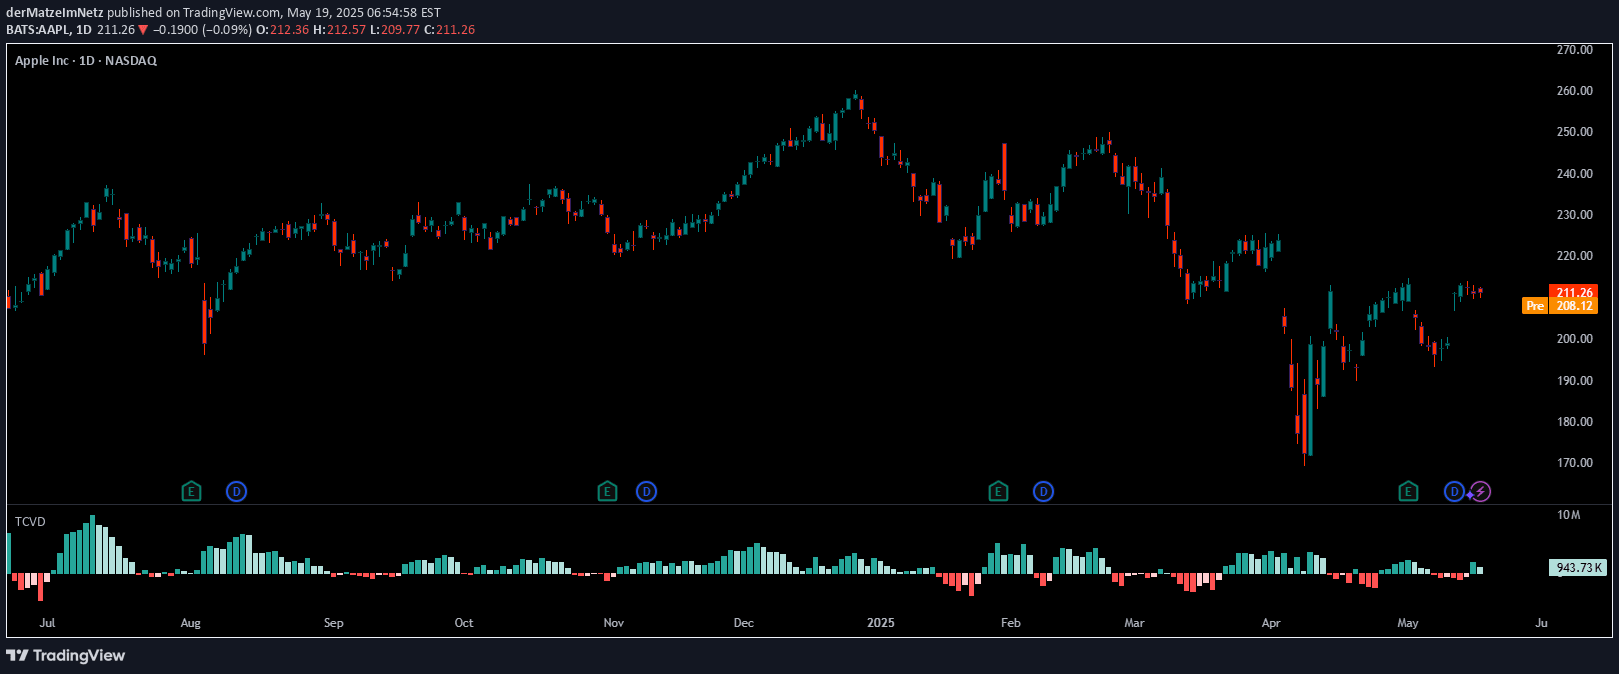
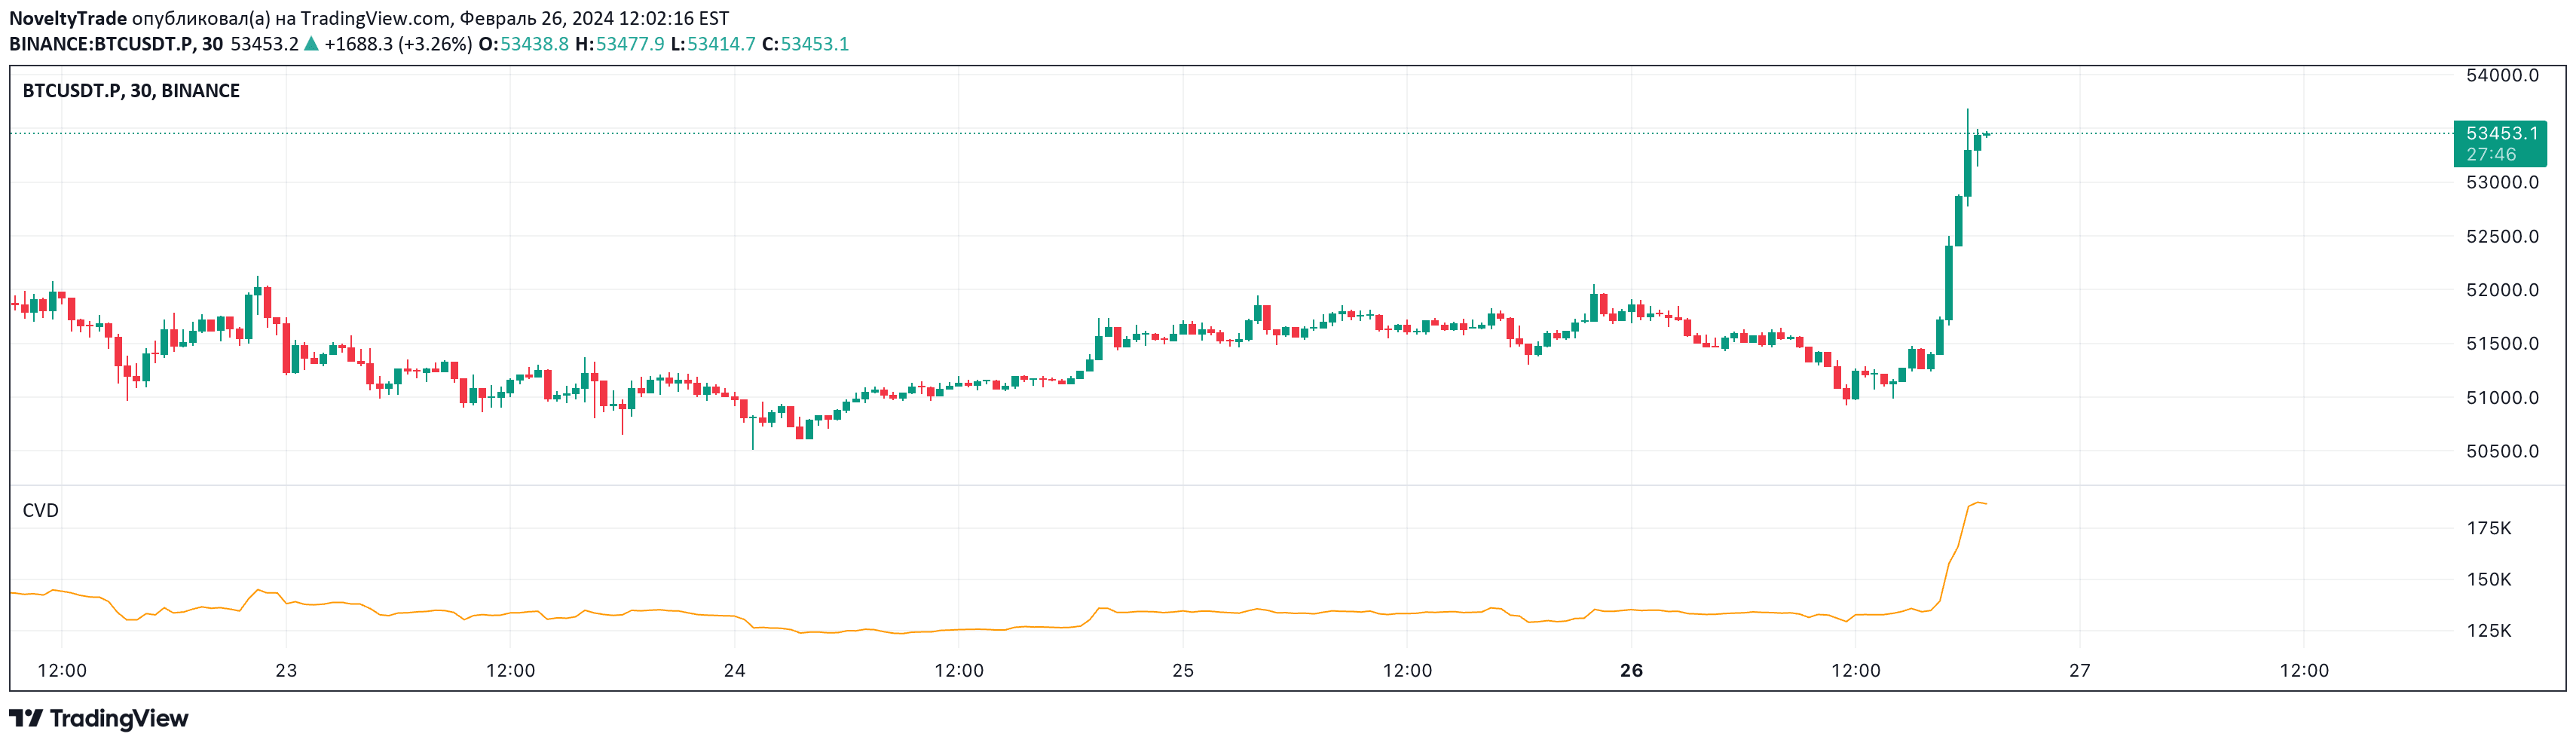
A custom volume indicator that analyzes current and average trading volume, displaying buy and sell percentages to help traders understand market sentiment and trading dynamics.
Explore complementary indicator rolesHow it works
The indicator calculates current volume metrics by tracking the total volume traded in the current bar and breaking down the volume into buy and sell percentages. It uses a simple moving average (SMA) to compute average volume over a specified number of bars, providing a smoothed perspective of trading activity.
The script employs conditional formatting to visually highlight the relationship between current and average volume metrics. Green and red color shades are used to quickly indicate the balance between buying and selling pressure, making it easy for traders to interpret the volume data at a glance.
Why it may be useful
Volume analysis is crucial for understanding market sentiment and potential price movements, as it reveals the strength behind price changes and trader participation. This indicator provides traders with a comprehensive view of trading activity, helping them identify potential trend confirmations or reversals based on volume dynamics.
By displaying both current and average volume metrics, the script offers insights into short-term and medium-term trading behavior. The visual representation of buy and sell percentages allows traders to quickly assess market sentiment and make more informed trading decisions.
When to explore it
This volume indicator is most effective in markets with significant trading activity, such as cryptocurrency and liquid financial instruments. It works best when used in conjunction with other technical analysis tools to confirm trends, identify potential momentum shifts, and assess market participation.
Traders can utilize this script across different timeframes, from scalping to swing trading, to gain insights into market dynamics. It is particularly useful during periods of market volatility, breakouts, or when trying to understand the underlying strength of price movements.
Keep exploring
What we’ve verified
Access, alerts and repainting behaviour have not been independently verified for this indicator. Check the creator’s current publication and settings.
General descriptions and classifications are recovered research. Verified details above identify the specific checks we have completed. Check the creator’s current publication for later changes.