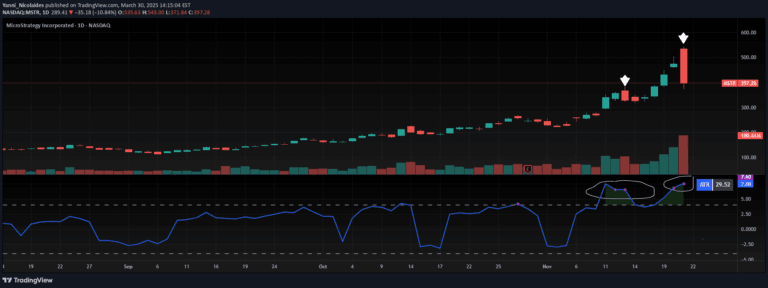
A custom ATR indicator that filters out extreme price bars to provide a more accurate measure of market volatility and current bar movement progress.
Explore complementary indicator rolesHow it works
The indicator begins by calculating the true range of each price bar in the market, examining the price movements and potential gaps between bars. It then applies a sophisticated filtering mechanism that removes bars with unusually large or small price ranges, ensuring that only representative price movements are considered.
After filtering out the outlier bars, the Average True Range (ATR) is recalculated using only the normalized price ranges. The system also tracks the current bar's progress by measuring how much the bar has moved relative to the filtered ATR, providing traders with a dynamic view of current market volatility and potential price momentum.
Why it may be useful
Traditional volatility measures can be skewed by extreme price movements that may not represent the true market conditions, potentially leading traders to make misguided decisions. This custom ATR approach helps smooth out these irregularities, offering a more reliable and nuanced view of market volatility that reflects more consistent price behavior.
By providing a refined volatility metric, traders can better understand the underlying market dynamics, adjust their risk management strategies, and make more informed trading decisions. The ability to filter out unusual price bars helps create a more stable and predictable framework for analyzing market movements.
When to explore it
This indicator is most effective in markets that experience occasional sharp price movements or significant volatility spikes, such as during economic news releases, earnings announcements, or periods of market uncertainty. It is particularly useful for traders who want a more stable representation of market volatility that isn't overly influenced by extreme outlier events.
Traders can benefit from this indicator across various timeframes and market conditions, especially when seeking to normalize volatility measurements and reduce the impact of rare, extraordinary price movements. It is particularly valuable for developing more robust trading strategies that require a consistent and reliable measure of market volatility.
Keep exploring
What we’ve verified
Access, alerts and repainting behaviour have not been independently verified for this indicator. Check the creator’s current publication and settings.
General descriptions and classifications are recovered research. Verified details above identify the specific checks we have completed. Check the creator’s current publication for later changes.