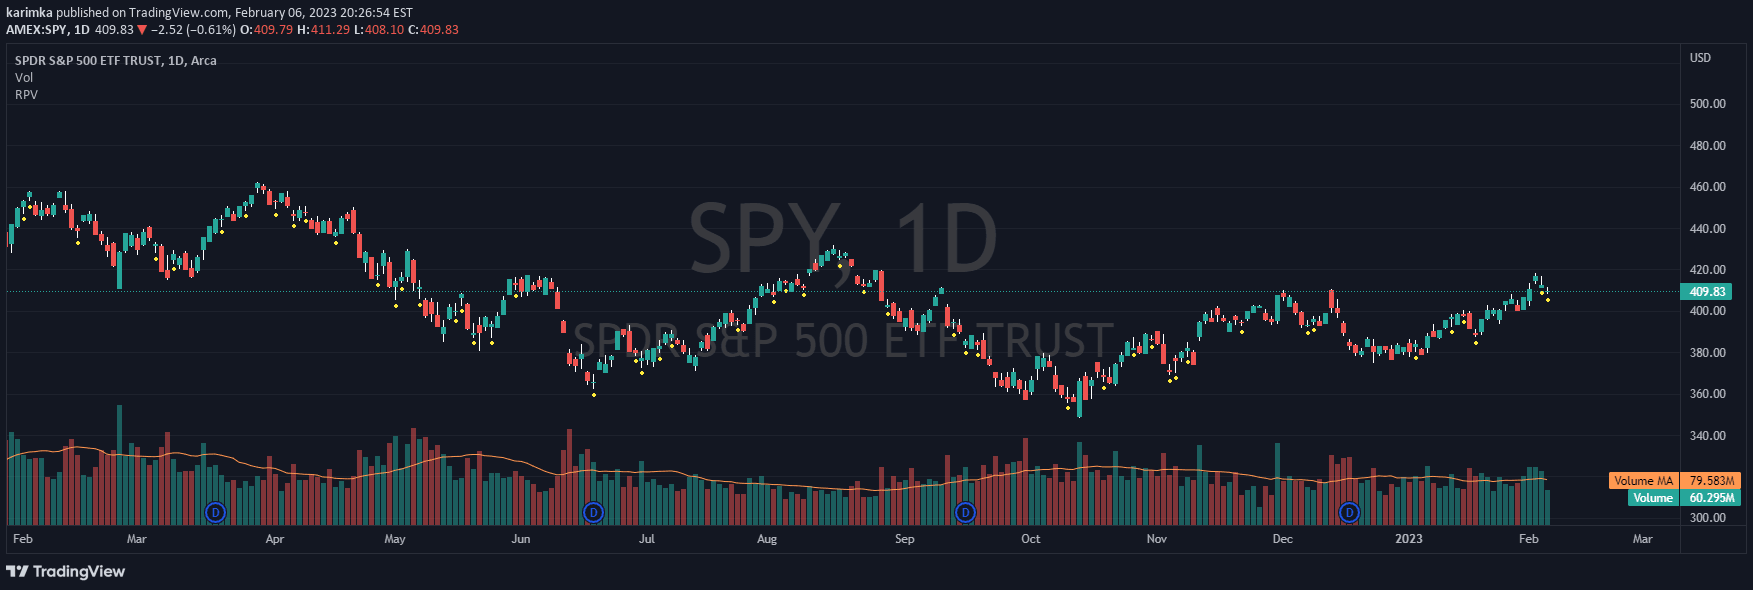
A volume-based indicator that highlights market conditions by tracking consecutive volume bars and placing directional arrows to signal potential trend changes or continuations.
Explore complementary indicator rolesHow it works
The indicator tracks volume bars across three consecutive trading periods, monitoring their color and directional characteristics. It specifically looks for a sequence where the first two volume bars are in the same direction (bullish or bearish) and the third bar is in the opposite direction with increased volume.
When this specific volume pattern is detected, the indicator automatically places an arrow above the third volume bar. Bullish conditions result in an upward white arrow, while bearish conditions trigger a downward blue arrow, providing visual confirmation of potential market shifts.
Why it may be useful
Volume analysis is crucial for understanding market sentiment and confirming price movements, as trading volume can reveal the strength behind price changes. This indicator provides traders with a quick visual method to identify potential trend reversals or continuations without complex manual calculations.
By combining volume direction, consistency, and magnitude, the indicator offers insights into market psychology and potential momentum shifts. Traders can use these signals to make more informed decisions about entry and exit points, enhancing their overall trading strategy.
When to explore it
This indicator works best in markets with clear volume trends and during periods of active trading with consistent volume patterns. It is particularly effective in liquid markets like major stock indices, forex pairs, and high-volume cryptocurrency trading pairs.
Traders should use this signal in conjunction with other technical indicators to confirm potential market movements. It is most reliable in timeframes ranging from 5-minute to daily charts, where volume patterns can be more clearly distinguished and meaningful.
Keep exploring
What we’ve verified
Access, alerts and repainting behaviour have not been independently verified for this indicator. Check the creator’s current publication and settings.
General descriptions and classifications are recovered research. Verified details above identify the specific checks we have completed. Check the creator’s current publication for later changes.