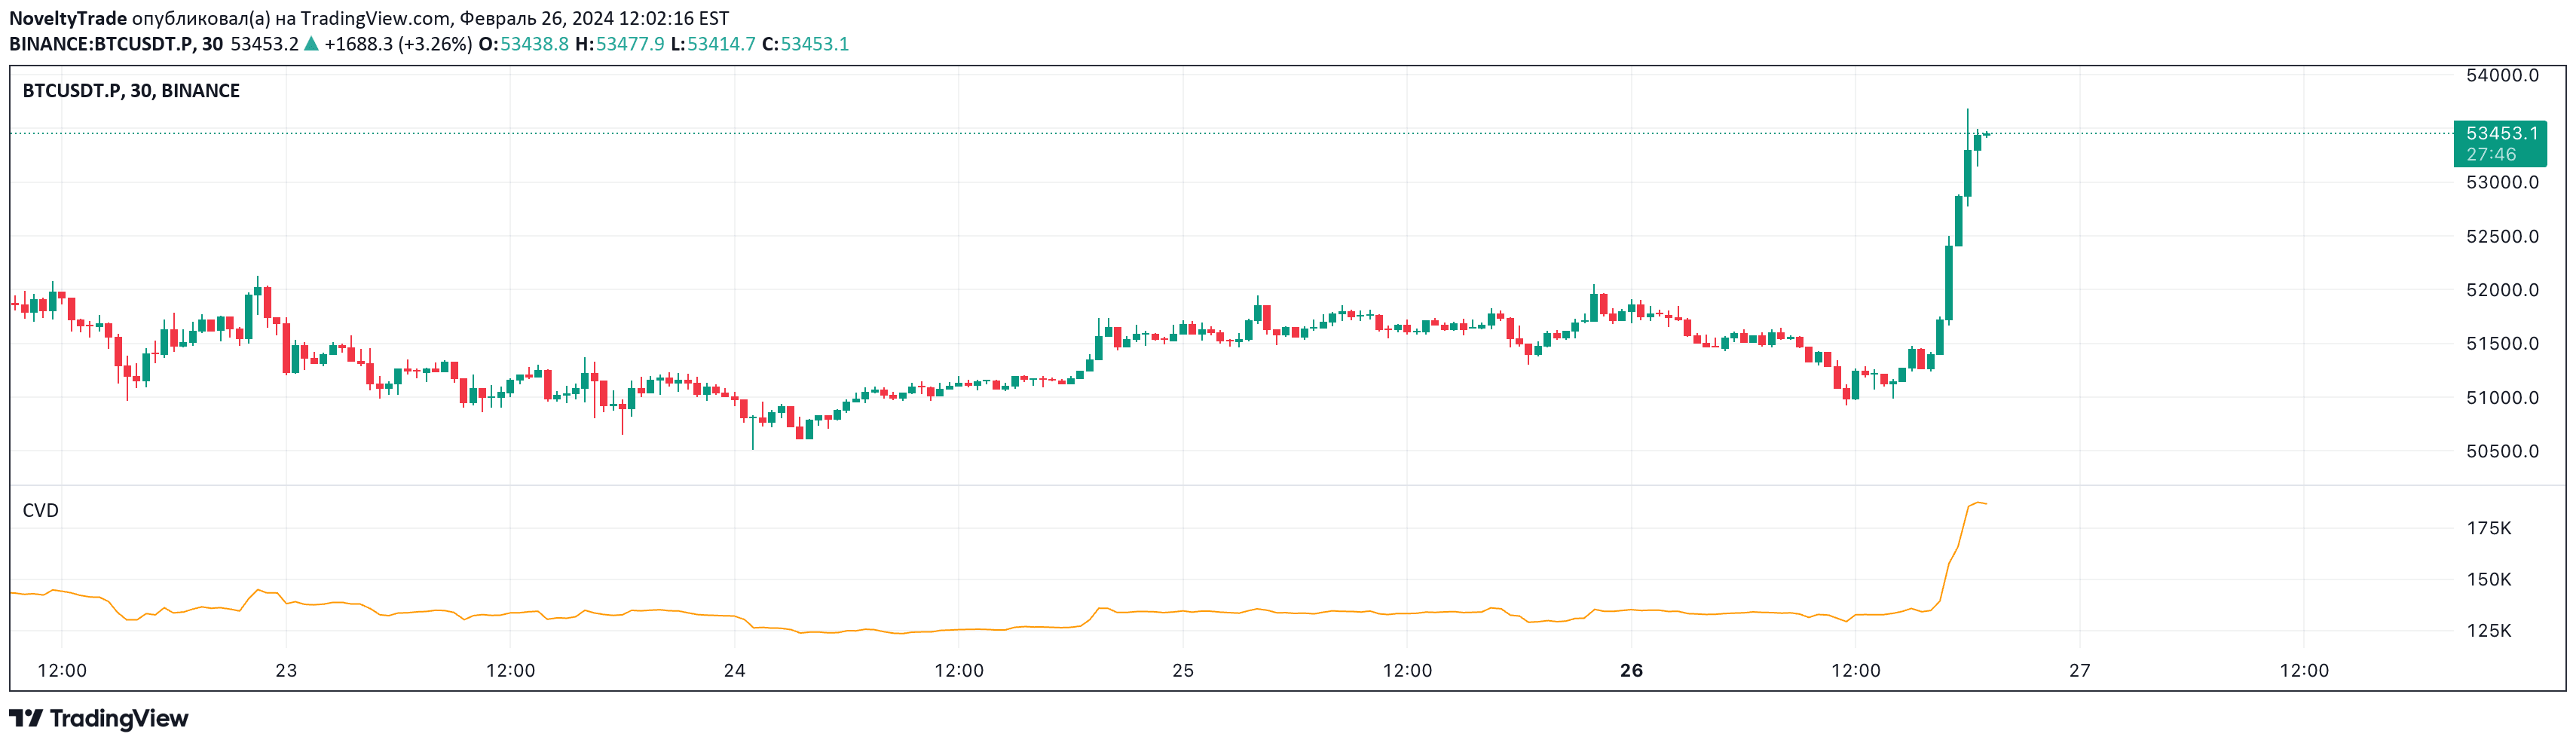
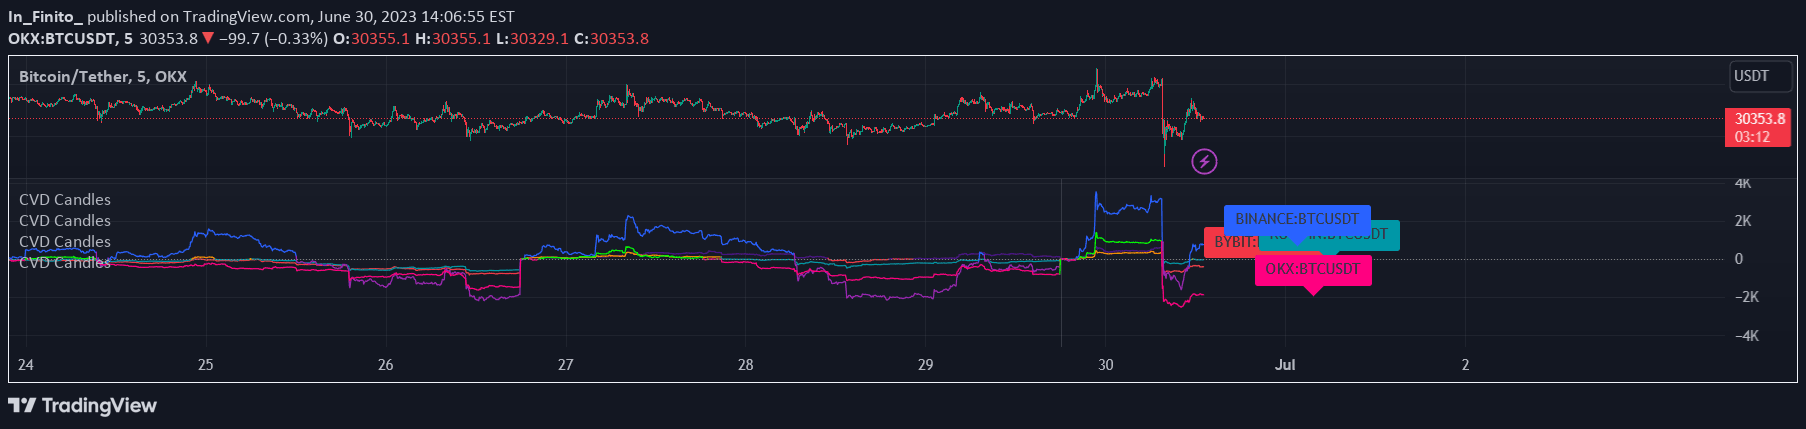
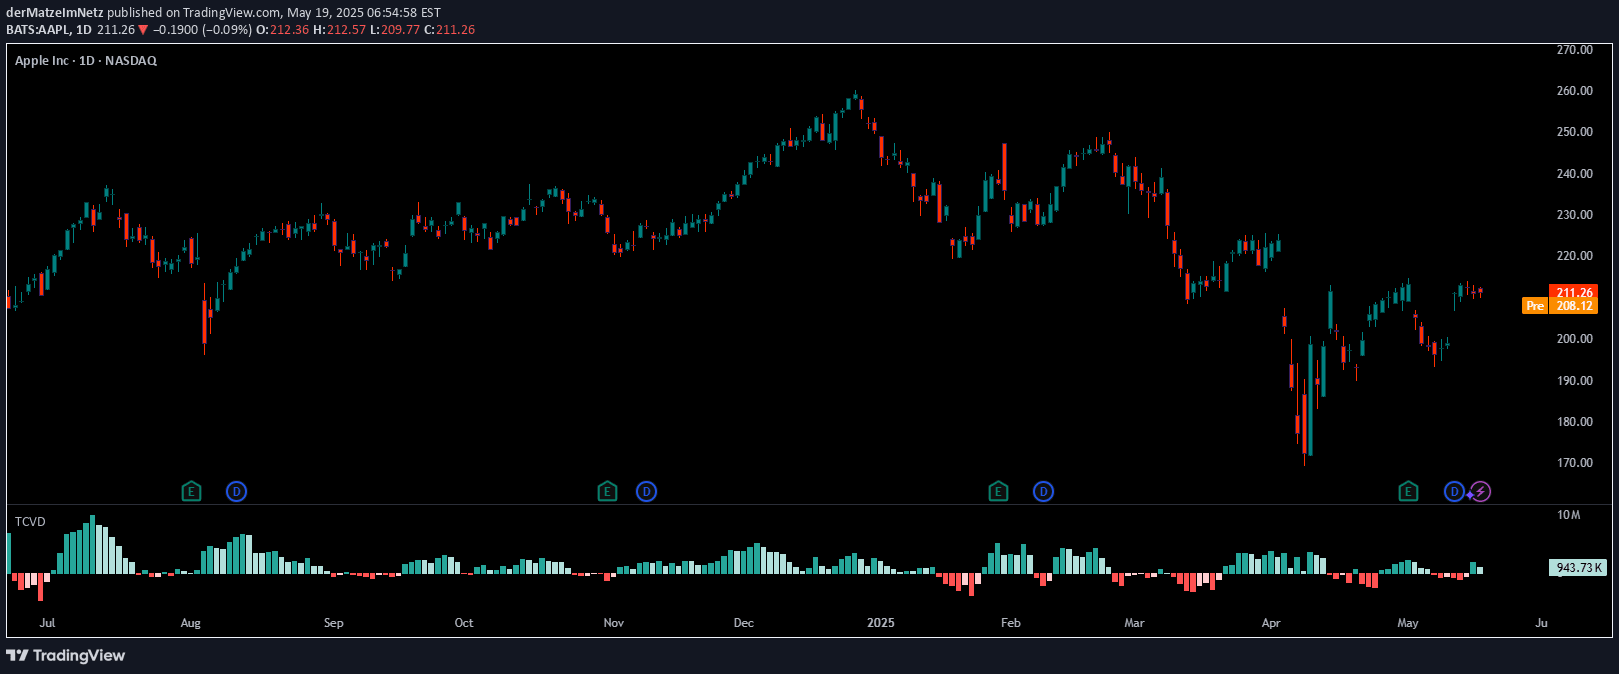
A cumulative volume delta indicator that uses intrabar analysis to precisely track buying and selling pressure across different timeframes, revealing hidden volume dynamics within price bars.
Explore complementary indicator rolesHow it works
The Cumulative Volume Delta (CVD) indicator calculates volume delta by analyzing intrabars within each chart bar. It determines whether volume is attributed to buying or selling pressure by comparing intrabar open and close prices. The script tracks volume movement up or down, accumulating delta values across configurable time periods.
By using lower timeframe data, it provides more precise volume information than traditional volume analysis methods. The indicator creates candles representing volume delta progression, with open, high, low, and close levels calculated from intrabar volume movements
Why it may be useful
Volume delta provides critical insights into market sentiment and potential price movements by revealing the underlying buying and selling pressure. Unlike standard volume indicators, this method offers granular analysis of volume dynamics within each price bar.
Traders can identify hidden market dynamics, detect potential trend reversals, and understand the strength of price movements. By showing cumulative volume trends, the indicator helps traders assess whether institutional or retail traders are driving market activity. This deeper volume analysis can enhance trading decisions and provide a more nuanced market perspective
When to explore it
This indicator works best in liquid markets with consistent volume data, such as major stock indices, forex pairs, and actively traded commodities. It is particularly useful during periods of market consolidation or when price action seems uncertain.
Traders can leverage this tool during trend identification, confirming breakouts, and assessing potential trend reversals. The CVD is most effective when combined with price action analysis and other technical indicators. It can help traders understand market sentiment in ranging and trending markets, providing valuable context for entry and exit decisions
Keep exploring
What we’ve verified
Access, alerts and repainting behaviour have not been independently verified for this indicator. Check the creator’s current publication and settings.
General descriptions and classifications are recovered research. Verified details above identify the specific checks we have completed. Check the creator’s current publication for later changes.