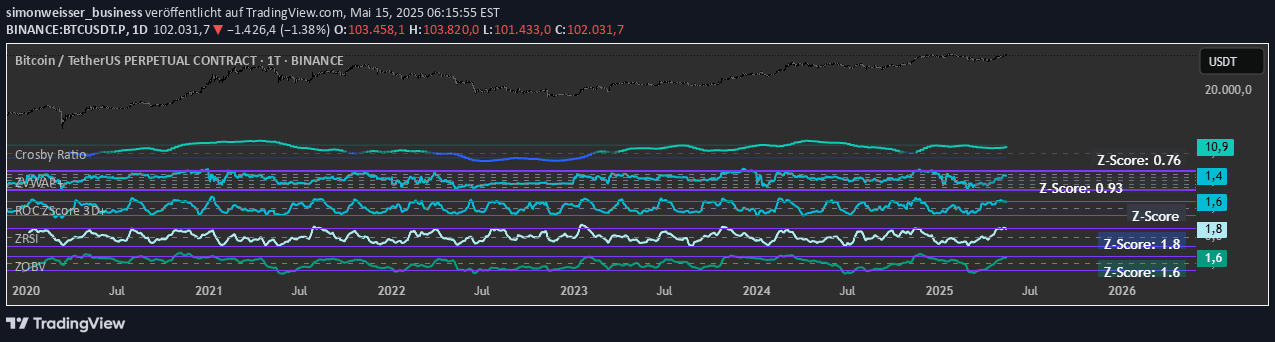
CVDD tracks coin movement between wallets by measuring unspent transaction outputs, providing insights into bitcoin transaction dynamics and potential market shifts.
Explore complementary indicator rolesHow it works
CVDD calculates the cumulative value of coin days destroyed by tracking how long bitcoins have been stationary before moving between wallets. When coins that have been dormant for a long time suddenly move, it generates a signal that suggests potential market activity or significant investor behavior.
The metric multiplies the number of coins transferred by the number of days those coins remained unused, creating a comprehensive measure of bitcoin transaction dynamics. By analyzing these movements, traders can gain insights into potential market trends, investor sentiment, and underlying blockchain activity.
Why it may be useful
CVDD provides unique insights into bitcoin market movements by revealing patterns of coin distribution and investor behavior that traditional price charts might not capture. It helps traders understand the depth and significance of transaction flows, offering a more nuanced view of market sentiment beyond simple price movements.
By tracking the age and movement of coins, CVDD can signal potential shifts in market dynamics, helping traders anticipate possible trend changes or significant market events. This metric offers a blockchain-level perspective that complements traditional technical analysis methods.
When to explore it
CVDD is most effective when analyzing bitcoin market trends, particularly during periods of potential market transition or when seeking to understand deeper market dynamics. Traders can use this signal to complement other technical indicators and gain a more comprehensive view of market movements.
The metric is particularly useful during periods of market uncertainty, when tracking large wallet movements or investigating potential significant investor actions. By monitoring coin days destroyed, traders can potentially identify early signs of market sentiment shifts or underlying blockchain activity.
Keep exploring
What we’ve verified
Access, alerts and repainting behaviour have not been independently verified for this indicator. Check the creator’s current publication and settings.
General descriptions and classifications are recovered research. Verified details above identify the specific checks we have completed. Check the creator’s current publication for later changes.