
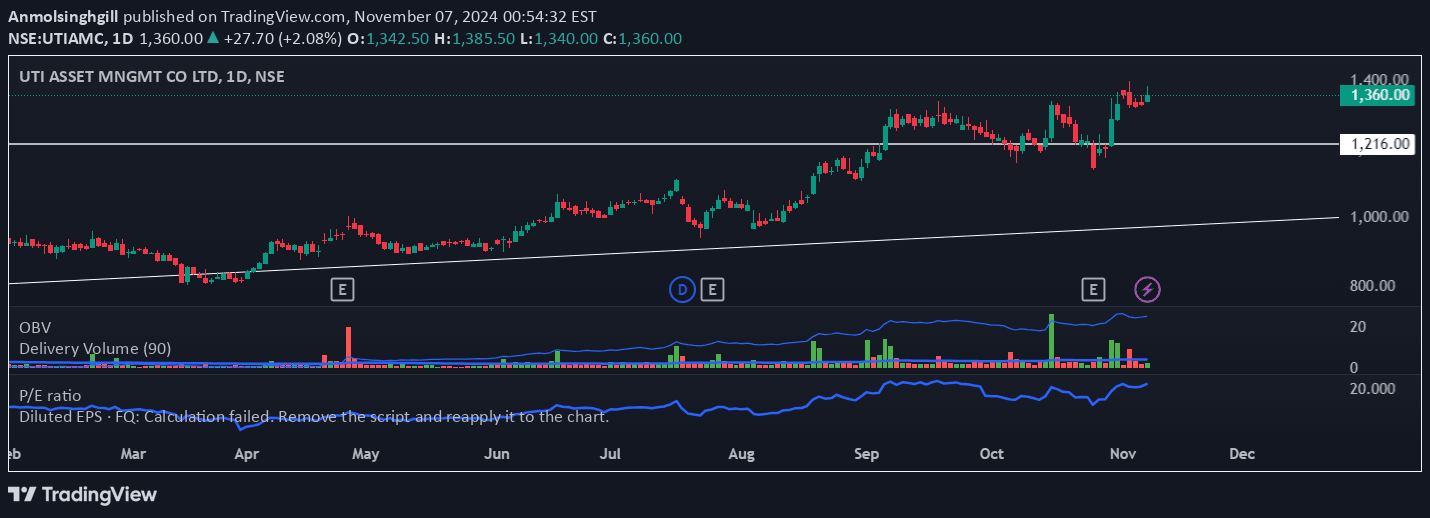
A daily volume indicator that measures delivery volume in lakhs, providing color-coded insights into market sentiment and volume trends with an adjustable EMA line.
Explore complementary indicator rolesHow it works
The Delivery Volume Indicator operates by tracking daily trading volume and scaling it to lakhs for easier interpretation. It calculates the volume for each trading day and color-codes the volume bars based on price action: green bars indicate bullish days where the closing price is higher than the opening price, while red bars represent bearish days with prices closing lower.
The indicator also incorporates an Exponential Moving Average (EMA) line in blue, which smooths out the volume data to help traders identify underlying volume trends. Traders can customize the EMA period to suit their specific trading strategy, allowing for more nuanced analysis of volume movements and market sentiment.
Why it may be useful
The Delivery Volume Indicator provides crucial insights into market dynamics by revealing the actual volume of trades that are settled through physical delivery of securities. This helps traders distinguish between speculative trading and genuine investment interest, offering a more transparent view of market sentiment and potential price movements.
By color-coding volume and incorporating a smoothing EMA, the indicator allows traders to quickly assess market trends and make more informed trading decisions. It bridges the gap between price action and volume analysis, enabling traders to understand the strength behind price movements and potential trend reversals.
When to explore it
The Delivery Volume Indicator is most effective during periods of significant market activity, such as earnings announcements, economic releases, or sector-specific news events. Traders can use this tool to confirm trend strength, identify potential trend reversals, and assess the conviction behind price movements in both bullish and bearish market conditions.
It is particularly useful for traders seeking to validate price action with volume data, providing a comprehensive view of market sentiment. The indicator works well across different timeframes, from short-term scalping to longer-term swing trading, making it a versatile tool for various trading strategies and market analysis approaches.
Keep exploring
What we’ve verified
Access, alerts and repainting behaviour have not been independently verified for this indicator. Check the creator’s current publication and settings.
General descriptions and classifications are recovered research. Verified details above identify the specific checks we have completed. Check the creator’s current publication for later changes.


