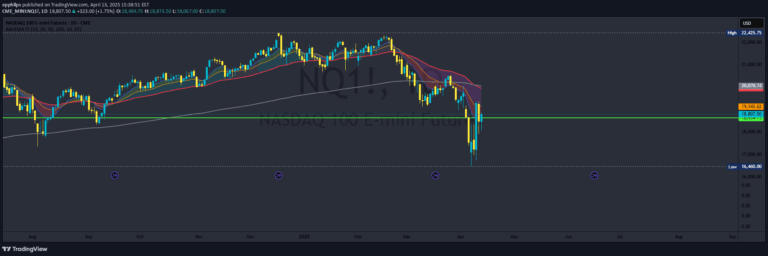
A crossover strategy combining Double Exponential Moving Average (DEMA) with two Exponential Moving Averages (EMAs) to detect trend reversals and capture market movements efficiently.
Explore complementary indicator rolesHow it works
The Dema Ema Crossover indicator operates by calculating a Double Exponential Moving Average (DEMA) as the foundational trend line, which reduces lag compared to traditional moving averages. Two Exponential Moving Averages (EMAs) are then applied to this DEMA: a fast EMA with a shorter period and a slow EMA with a longer period.
When the fast EMA crosses above the slow EMA, it generates a buy signal, indicating a potential upward trend. Conversely, when the fast EMA crosses below the slow EMA, it produces a sell signal, suggesting a possible downward trend. This crossover mechanism helps traders identify potential trend reversals and entry or exit points with improved responsiveness.
Why it may be useful
The Dema Ema Crossover provides traders with a sophisticated tool for understanding market dynamics by combining multiple moving average techniques. By leveraging the DEMA's reduced lag and the precision of EMA crossovers, traders can gain more accurate insights into potential trend changes and market momentum.
This approach helps minimize false signals and offers a more nuanced view of market movements. The indicator's ability to adapt to different market conditions and timeframes makes it valuable for traders seeking a reliable method to confirm trend direction and make more informed trading decisions.
When to explore it
The Dema Ema Crossover is most effective in markets with clear trending characteristics, where price movements show consistent directional momentum. It performs exceptionally well in both volatile and stable market environments, allowing traders to capture significant trend shifts across various timeframes.
Traders should consider using this indicator when seeking to identify early trend reversals, confirm existing trend directions, and develop more precise entry and exit strategies. It is particularly useful for traders who want a flexible tool that can be customized to match different market conditions and individual trading preferences.
Keep exploring
What we’ve verified
Access, alerts and repainting behaviour have not been independently verified for this indicator. Check the creator’s current publication and settings.
General descriptions and classifications are recovered research. Verified details above identify the specific checks we have completed. Check the creator’s current publication for later changes.