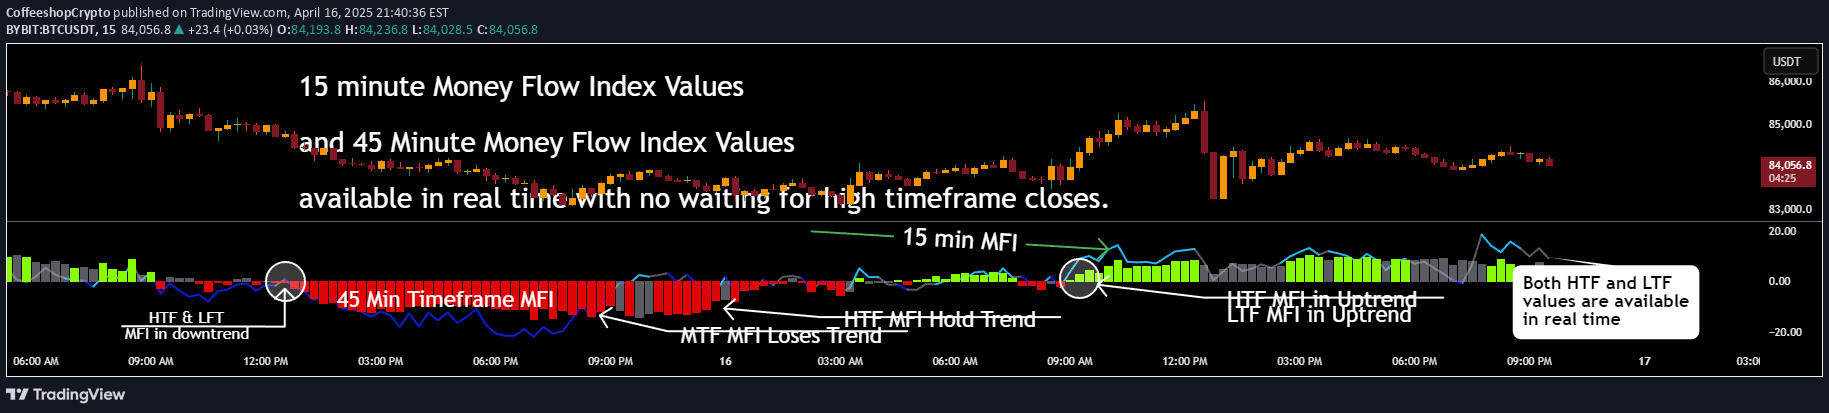
A Money Flow Index enhanced with Discrete Fourier Transform smoothing to filter market noise and provide clearer trend identification through advanced frequency analysis.
Explore complementary indicator rolesHow it works
The Discrete Fourier Transform Money Flow Index (FMFI) combines the Money Flow Index with DFT smoothing to analyze market trends. It calculates the MFI using a formula that compares buying and selling pressures, then applies Discrete Fourier Transform to filter out short-term noise and emphasize dominant market frequencies.
By focusing on the fundamental frequency component, the indicator captures the core cyclic behavior of price movements. The resulting smoothed MFI provides a more refined view of market momentum, with color-coded trends (white for bullish, purple for bearish) and signal markers that help traders quickly interpret market conditions.
Why it may be useful
The FMFI offers traders a sophisticated tool for understanding market dynamics by integrating advanced mathematical techniques with traditional momentum analysis. It helps traders cut through market noise and identify more reliable trend signals, reducing the impact of short-term fluctuations that can lead to false interpretations.
By combining the Money Flow Index with Discrete Fourier Transform, the indicator provides a more nuanced view of market pressure and potential trend reversals. This approach allows traders to make more informed decisions by focusing on sustained market movements rather than getting distracted by temporary price variations.
When to explore it
The FMFI is most effective in markets with clear directional trends and during periods of moderate to high volatility. Traders can leverage this indicator across various timeframes, from short-term scalping to longer-term swing trading, making it a versatile tool for different trading strategies.
It works best when used in conjunction with other technical analysis tools, helping to confirm signals and provide additional context for trading decisions. Traders should pay special attention to the indicator's color changes, signal markers, and trend arrows to identify potential entry and exit points in their trading activities.
Keep exploring
What we’ve verified
Access, alerts and repainting behaviour have not been independently verified for this indicator. Check the creator’s current publication and settings.
General descriptions and classifications are recovered research. Verified details above identify the specific checks we have completed. Check the creator’s current publication for later changes.