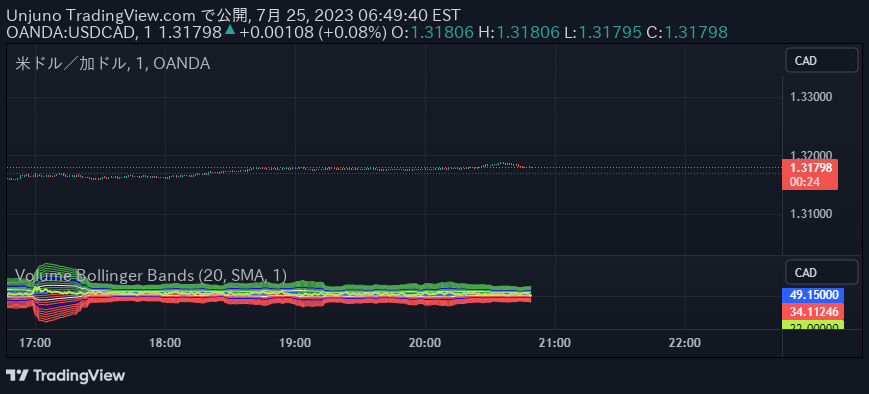
Dynamic Bollinger Bands that adapt to market momentum and volume, providing enhanced insights into price volatility and potential trading reversals with adjustable sensitivity.
Explore complementary indicator rolesHow it works
The Dynamic Bollinger Bands with Momentum and Volume (DBBMV) indicator begins with traditional Bollinger Bands, calculated using a moving average and standard deviation of the price. It then dynamically adjusts the bands' width based on price momentum, making them more responsive to market changes.
The indicator further refines the bands by incorporating trading volume, which helps ensure the bands accurately reflect current market conditions. This results in a more nuanced set of Bollinger Bands that can provide traders with more precise insights into potential price movements and volatility.
Why it may be useful
Traditional Bollinger Bands can sometimes provide static and delayed signals, which may not capture the rapidly changing market dynamics. The DBBMV indicator addresses this limitation by creating a more adaptive and responsive analytical tool that considers both price momentum and trading volume.
By dynamically adjusting the bands, traders gain a more sophisticated method of identifying potential market reversals, breakouts, and volatility shifts. This approach allows for more refined and context-aware trading decisions, helping traders better understand and react to complex market movements.
When to explore it
The DBBMV indicator is most effective in markets experiencing significant price fluctuations and where volume plays a crucial role in trend confirmation. It works particularly well in volatile markets such as cryptocurrencies, forex, and actively traded stocks where momentum and volume provide meaningful insights.
Traders should use this indicator when they want to identify potential entry and exit points with greater precision, confirm trend strength, and gain a more comprehensive understanding of market conditions beyond traditional static band measurements.
Keep exploring
What we’ve verified
Access, alerts and repainting behaviour have not been independently verified for this indicator. Check the creator’s current publication and settings.
General descriptions and classifications are recovered research. Verified details above identify the specific checks we have completed. Check the creator’s current publication for later changes.