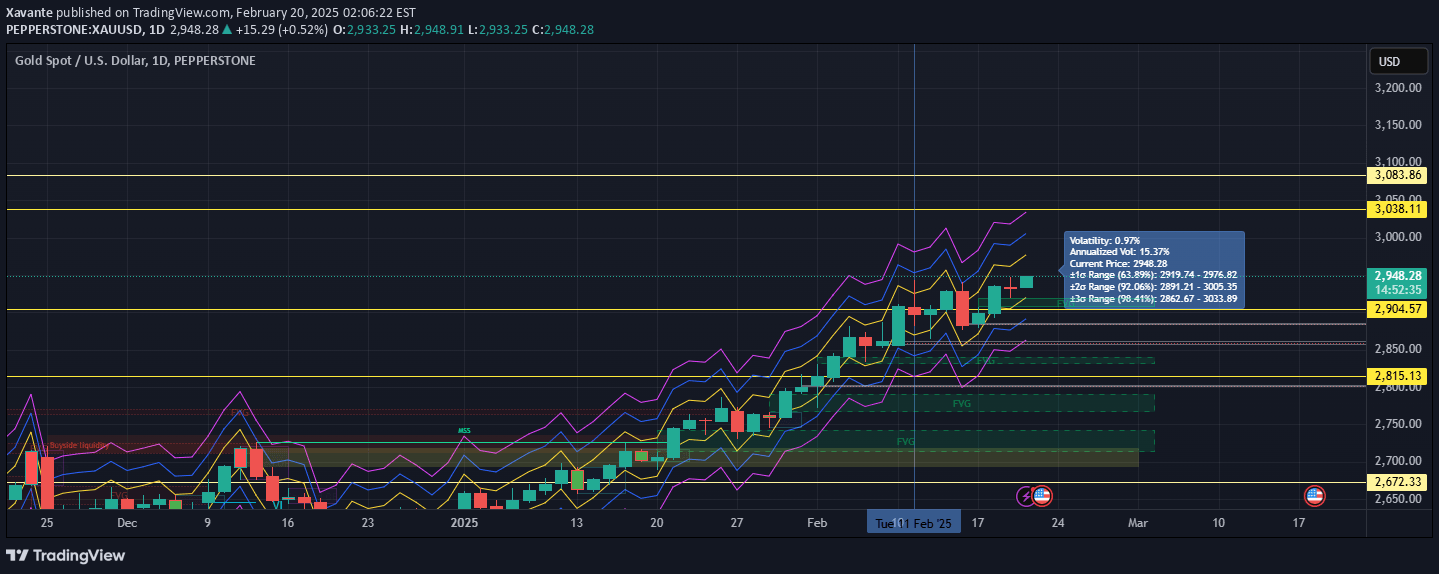
A powerful trading indicator that measures market volatility through candle movements, volume analysis, and MACD trend prediction to identify potential trading opportunities.
Explore complementary indicator rolesHow it works
The indicator evaluates price volatility by calculating average volume using customizable moving averages and measuring candle body changes and high-low ranges. It creates a unique weighted index by dividing price change by average volume and recent volatility, which helps identify significant market movements.
When the weighted index exceeds a user-defined threshold, the candle is highlighted to signal potential trading opportunities. The MACD indicator is simultaneously plotted to provide trend analysis, with adjustable parameters allowing traders to fine-tune the indicator's sensitivity and visualization according to their specific trading strategy and market conditions.
Why it may be useful
This indicator provides traders with a comprehensive market analysis tool that combines multiple analytical techniques to enhance decision-making. By integrating volatility detection, volume analysis, and trend prediction, traders can gain deeper insights into market dynamics and potential price movements.
The multi-dimensional approach allows traders to identify not just price changes, but also understand the underlying market momentum and volume-driven trends. This holistic view helps traders make more informed decisions, reducing the risk of trading based on incomplete or isolated market signals.
When to explore it
The indicator is most effective during periods of market transition, such as potential trend reversals or breakout scenarios. It excels in identifying volatile market conditions where significant price movements are likely, making it particularly useful for traders seeking to capture rapid market changes.
Traders can leverage this tool across various timeframes and market conditions, from quick scalping opportunities to longer-term swing trading strategies. It is especially valuable when traditional indicators might provide conflicting signals, as its comprehensive approach integrates multiple market analysis techniques to provide a more nuanced understanding of market behavior.
Keep exploring
What we’ve verified
Access, alerts and repainting behaviour have not been independently verified for this indicator. Check the creator’s current publication and settings.
General descriptions and classifications are recovered research. Verified details above identify the specific checks we have completed. Check the creator’s current publication for later changes.