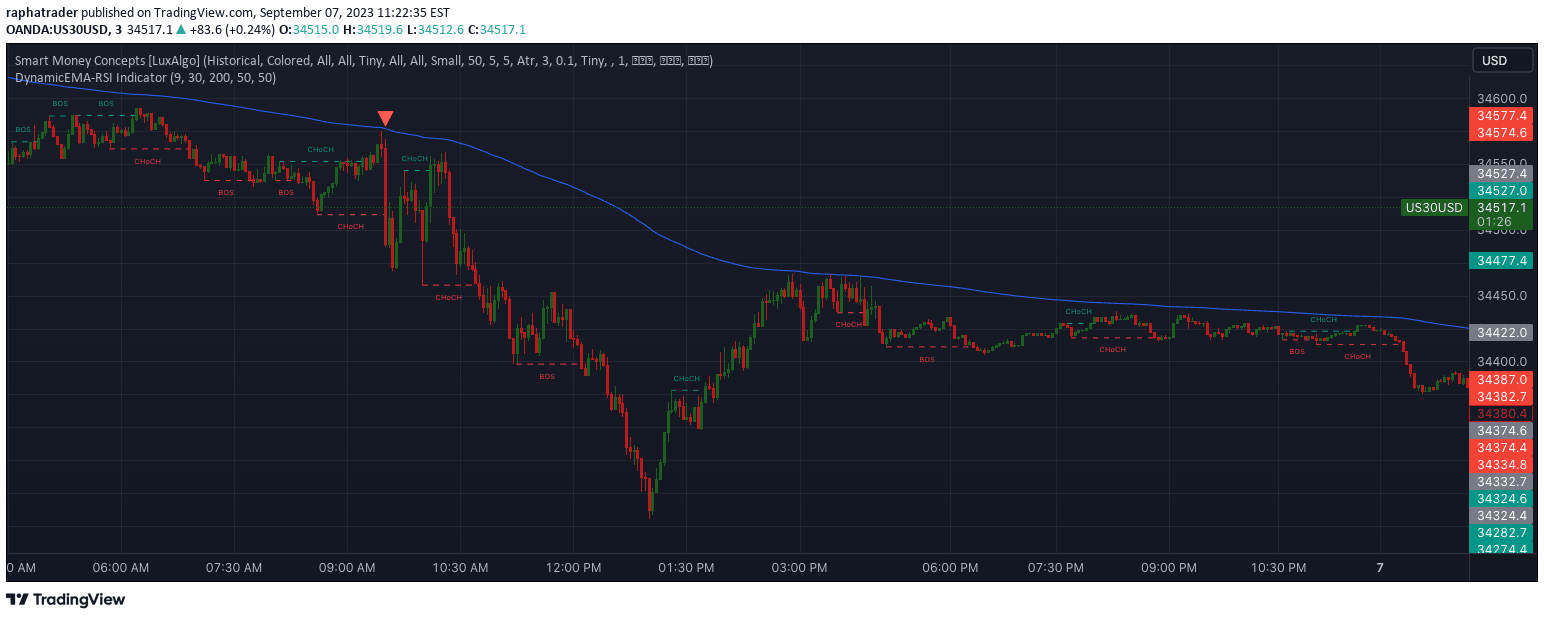
A powerful trading indicator combining EMA and RSI to generate high-precision daily signals for US30 and USDJPY markets with proven accuracy and strategic market insights.
Explore complementary indicator rolesHow it works
The Custom EMA and RSI Indicator operates by integrating two powerful technical analysis tools: Exponential Moving Averages and the Relative Strength Index. The EMA helps identify the current trend direction by smoothing price data and giving more weight to recent prices, creating a dynamic trend line that adapts quickly to market changes. The RSI complements this by measuring the magnitude of recent price changes to evaluate overbought or oversold conditions.
By combining these two indicators, the system generates precise trading signals once per day. When the EMA indicates a clear trend and the RSI confirms momentum in that direction, the indicator suggests potential entry points for traders. This dual-confirmation approach helps reduce false signals and provides a more robust method for identifying high-probability trading opportunities.
Why it may be useful
Technical indicators like the Custom EMA and RSI are crucial for traders seeking to make informed, data-driven decisions in volatile markets. By providing a systematic approach to analyzing price movements, these tools help traders overcome emotional trading and rely on quantitative analysis. The combination of trend and momentum indicators offers a more comprehensive view of market dynamics than single-indicator strategies.
Moreover, this indicator's focus on specific currency pairs like US30 and USDJPY allows for targeted, specialized analysis. Traders can benefit from its high-accuracy signals, which help minimize risk and maximize potential returns. The methodical approach of blending EMA and RSI provides a nuanced understanding of market conditions that can significantly improve trading performance.
When to explore it
The Custom EMA and RSI Indicator is most effective in markets with clear trend characteristics, such as the US30 and USDJPY pairs. It performs exceptionally well during periods of sustained directional movement, where trends are relatively stable and momentum is consistent. Traders should consider using this indicator during times of moderate market volatility, where price movements are predictable and follow recognizable patterns.
Ideal usage scenarios include daily and swing trading timeframes, where traders have time to analyze signals and make strategic decisions. The indicator is particularly useful for traders who prefer a systematic, data-driven approach to market analysis. It works best when combined with other technical and fundamental analysis tools, providing an additional layer of confirmation for potential trading opportunities.
Keep exploring
What we’ve verified
Access, alerts and repainting behaviour have not been independently verified for this indicator. Check the creator’s current publication and settings.
General descriptions and classifications are recovered research. Verified details above identify the specific checks we have completed. Check the creator’s current publication for later changes.