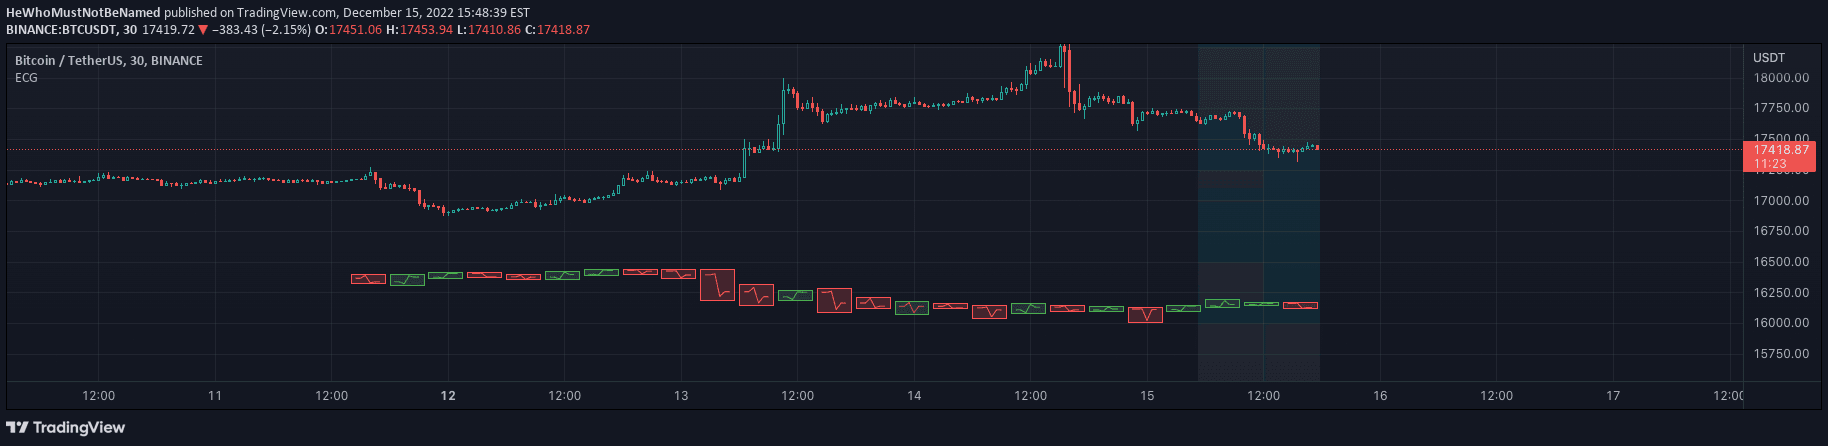
A unique trading chart visualization that replaces traditional candlesticks with electrocardiogram-style blocks, using signal lines to represent price movement and market sentiment.
Explore complementary indicator rolesHow it works
This chart visualization transforms traditional candlestick charts into electrocardiogram-like blocks with five connecting signal lines. The body color of each block is determined by the open and close prices, with green indicating a higher close and red indicating a lower close.
The border color reflects the comparison between current and previous bar closes. The five signal lines connect key price points: open-open, open-first peak, first peak-second peak, second peak-close, and close-close
Why it may be useful
This innovative chart type provides traders with a more dynamic and visually intuitive representation of price movement. By mimicking an electrocardiogram, it offers a unique perspective on market sentiment and price dynamics.
The color-coded blocks and signal lines help traders quickly assess market trends, identify potential reversals, and understand the underlying price action more intuitively than traditional candlestick charts
When to explore it
This chart visualization is most effective for traders seeking a more nuanced view of price action across various markets and timeframes. It works best in markets with clear trends and significant price movements, such as stocks, forex, and cryptocurrencies. Traders who prefer visual storytelling and want to understand market psychology beyond standard price charts will find this approach particularly valuable
Keep exploring
What we’ve verified
Access, alerts and repainting behaviour have not been independently verified for this indicator. Check the creator’s current publication and settings.
General descriptions and classifications are recovered research. Verified details above identify the specific checks we have completed. Check the creator’s current publication for later changes.