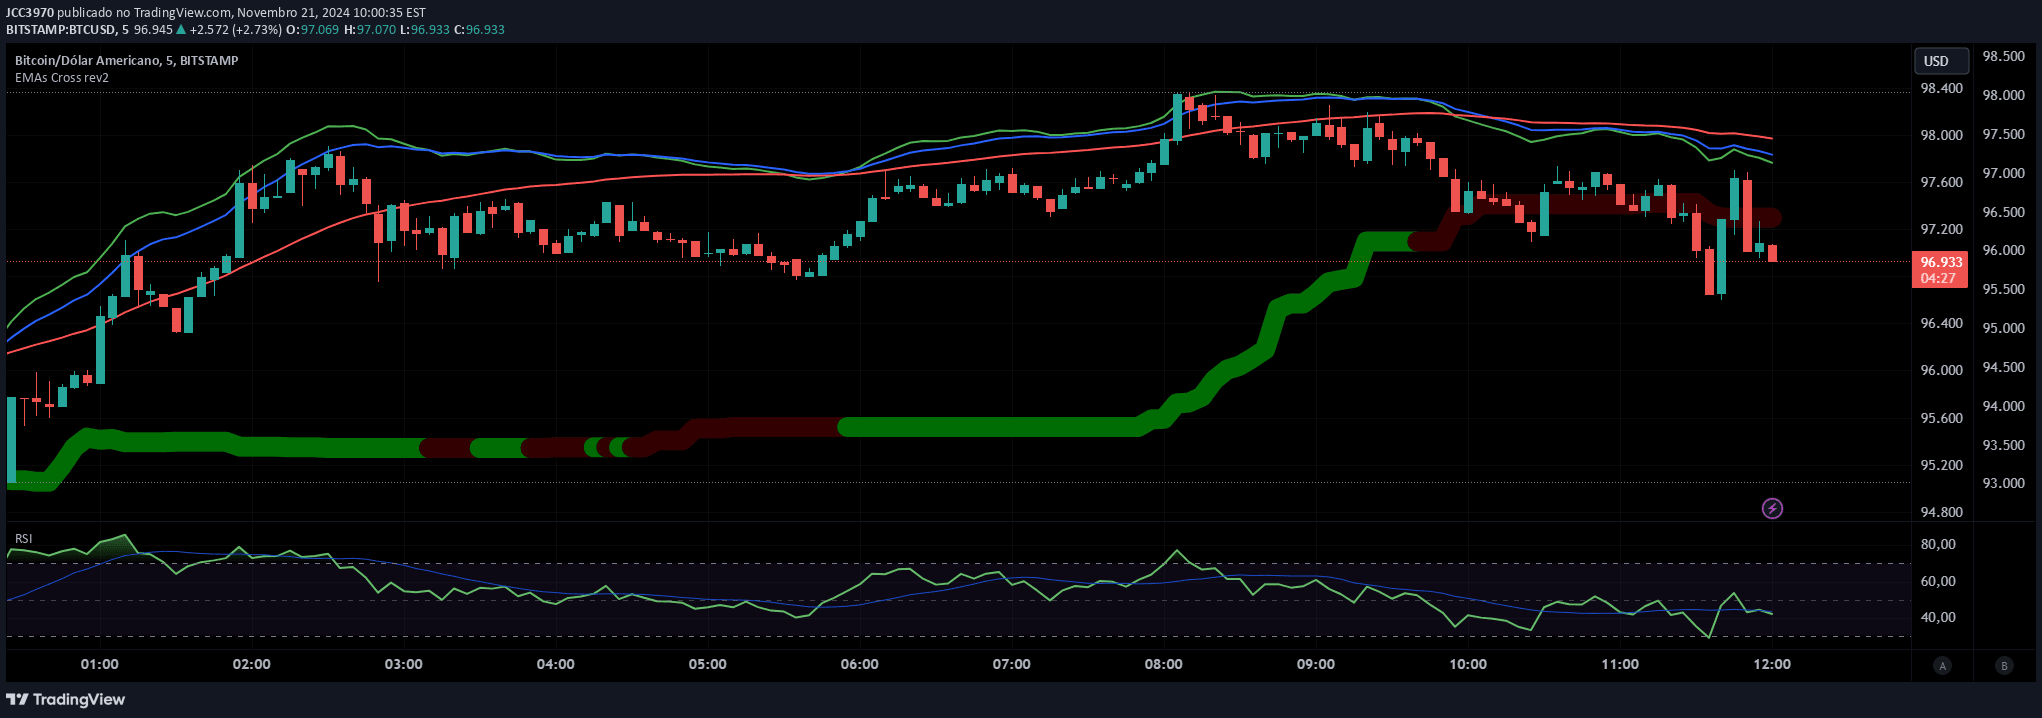
A technical analysis tool combining Exponential Moving Averages and SuperTrend to identify market trends, provide entry/exit signals, and help traders make informed trading decisions.
Explore complementary indicator rolesHow it works
The Combined EMA & SuperTrend Indicator operates by integrating two powerful technical analysis tools. The Exponential Moving Averages (EMAs) are calculated by giving more weight to recent price data, creating dynamic trend lines that represent short-term and long-term market momentum. These EMAs are plotted on the chart, allowing traders to observe potential trend changes when shorter-term EMAs cross above or below longer-term EMAs.
The SuperTrend component adds another layer of analysis by incorporating the Average True Range (ATR) to determine trend direction and potential stop-loss levels. By using a user-defined factor, the SuperTrend line changes color to indicate market trends, with green representing an uptrend and red signaling a downtrend. This combination provides traders with a comprehensive view of market conditions and potential trading opportunities.
Why it may be useful
The Combined EMA & SuperTrend Indicator is crucial for traders seeking a holistic approach to market analysis. By integrating multiple technical indicators, it offers a more nuanced understanding of market trends than single-indicator strategies. The EMAs help smooth out price fluctuations and reveal underlying market momentum, while the SuperTrend provides clear visual cues about trend direction and potential reversal points.
Moreover, this indicator's versatility allows traders to adapt it to various trading styles and timeframes. The built-in alerts and customizable parameters enable traders to personalize their analysis, making it easier to identify potential entry and exit points. By combining trend identification, momentum analysis, and adaptive stop-loss strategies, this indicator empowers traders to make more informed and disciplined trading decisions.
When to explore it
The Combined EMA & SuperTrend Indicator is most effective in trending markets with clear directional movements. It performs exceptionally well in cryptocurrency, forex, and stock markets where price trends can be more pronounced and volatile. Traders should utilize this indicator when seeking to confirm trend strength, identify potential trend reversals, and establish robust entry and exit strategies.
This indicator is particularly useful during periods of market transition, such as when prices are breaking out of consolidation zones or experiencing significant momentum shifts. Traders can benefit from its signals across multiple timeframes, from short-term scalping to longer-term swing trading. However, it's essential to combine this indicator with other technical and fundamental analysis tools to validate signals and manage risk effectively.
Keep exploring
What we’ve verified
Access, alerts and repainting behaviour have not been independently verified for this indicator. Check the creator’s current publication and settings.
General descriptions and classifications are recovered research. Verified details above identify the specific checks we have completed. Check the creator’s current publication for later changes.