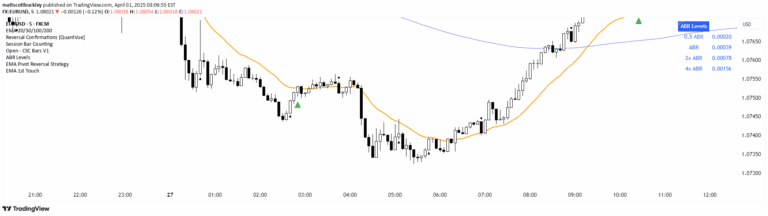
An advanced EMA-based indicator that measures price distance from a dynamic exponential moving average, helping traders identify trend strength, potential pullbacks, and market momentum.
Explore complementary indicator rolesHow it works
The indicator calculates a customizable Exponential Moving Average (EMA) that adapts dynamically to recent price movements. For each candle, it measures the distance between the price and the EMA, using the high point if the price is above the EMA and the low point if below.
The calculation provides a real-time numerical representation of how far the current price has deviated from the selected EMA period, offering insights into market behavior and potential trend dynamics
Why it may be useful
This indicator goes beyond traditional EMA plotting by providing quantifiable price distance information. Traders can quickly assess whether a price is overextended, losing momentum, or potentially preparing for a reversal. By offering both visual and numerical data, it helps traders make more informed decisions about market conditions, entry and exit points, and potential trend strength or weakness
When to explore it
The EMA Price Range Indicator is most effective during trending markets where price movement relative to a key moving average is crucial. It works well for trend-following strategies, identifying potential pullback opportunities, and assessing market momentum.
Traders can apply it across various timeframes, from short-term day trading to longer swing trading scenarios, making it versatile for different trading styles and market conditions
Keep exploring
What we’ve verified
Access, alerts and repainting behaviour have not been independently verified for this indicator. Check the creator’s current publication and settings.
General descriptions and classifications are recovered research. Verified details above identify the specific checks we have completed. Check the creator’s current publication for later changes.