
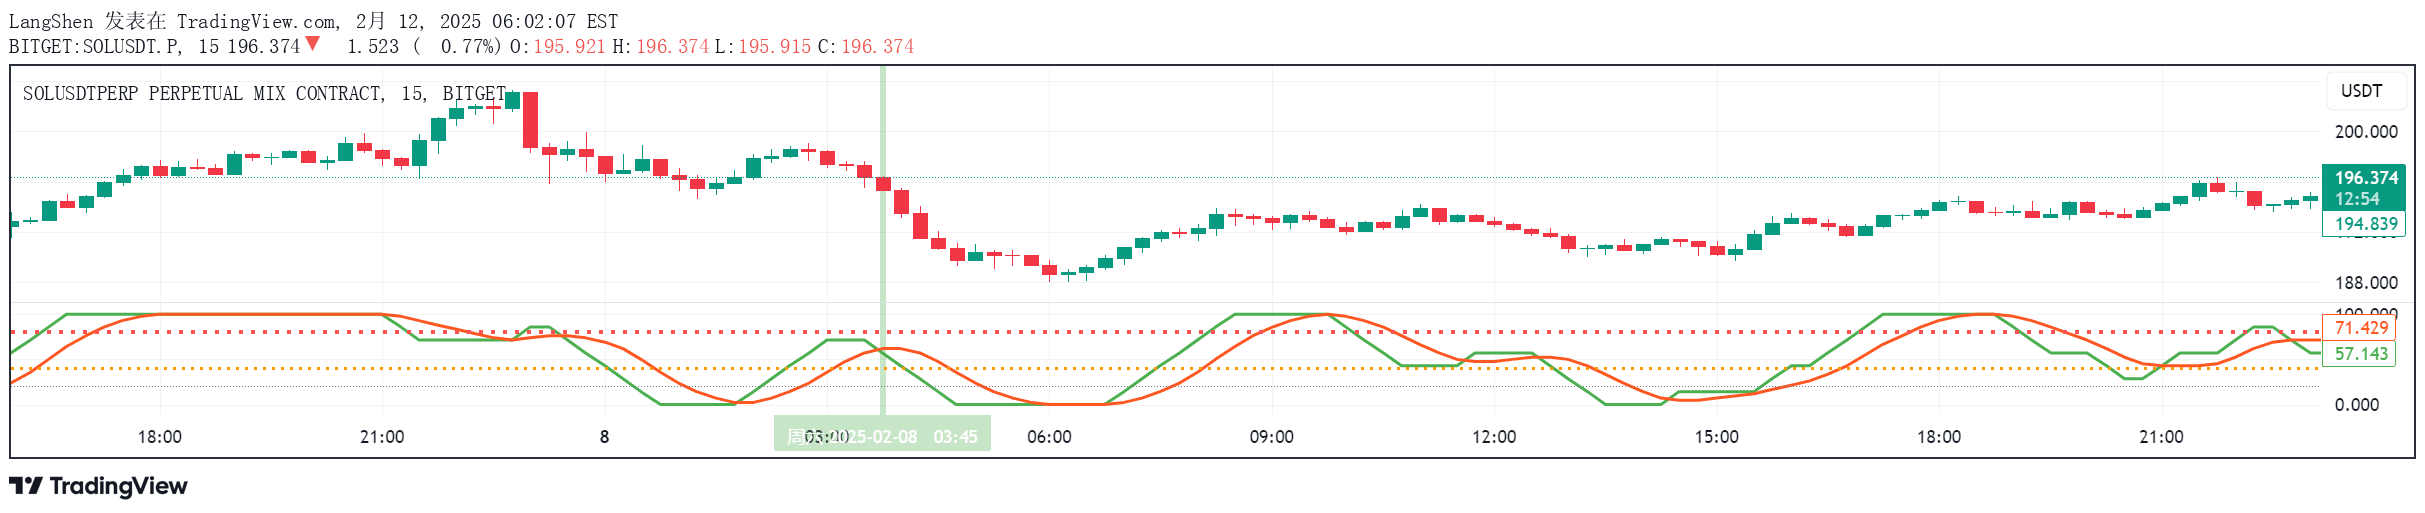
A sentiment indicator that tracks market momentum through an emotion line, helping traders identify potential trend shifts and entry/exit points using dynamic moving averages and efficiency calculations.
Explore complementary indicator rolesHow it works
The indicator calculates a unique 'Emotion Line' by analyzing price movement efficiency and directional changes. It uses a complex algorithm that transforms raw price data into a smoothed sentiment metric, tracking how price moves relative to volume and historical trends.
The calculation involves multiple steps including a dynamic Ray calculation, creating a Close Line, measuring directional changes, and computing an efficiency ratio. This process generates a responsive indicator that adapts to market conditions, providing traders with a nuanced view of underlying market sentiment.
Why it may be useful
The sentiment indicator offers traders a sophisticated tool for understanding market dynamics beyond traditional price analysis. By quantifying market sentiment through an adaptive algorithm, it provides insights into potential trend strength and momentum that conventional indicators might miss.
Traders can use this method to gain a competitive edge by identifying subtle shifts in market psychology. The indicator's ability to transform complex price data into a clear, actionable sentiment metric makes it valuable for making more informed trading decisions across different market conditions.
When to explore it
This indicator works best in markets with clear trending behavior, particularly in stocks, forex, and cryptocurrency markets with sufficient liquidity and price movement. It is most effective when combined with other technical analysis tools to confirm signals and validate potential trade entries or exits.
Traders should adjust the indicator's period settings based on their specific trading timeframe, using shorter periods for more responsive signals in scalping and day trading, and longer periods for more stable swing trading strategies. The indicator's versatility makes it suitable for multiple market environments and trading styles.
Keep exploring
What we’ve verified
Access, alerts and repainting behaviour have not been independently verified for this indicator. Check the creator’s current publication and settings.
General descriptions and classifications are recovered research. Verified details above identify the specific checks we have completed. Check the creator’s current publication for later changes.


