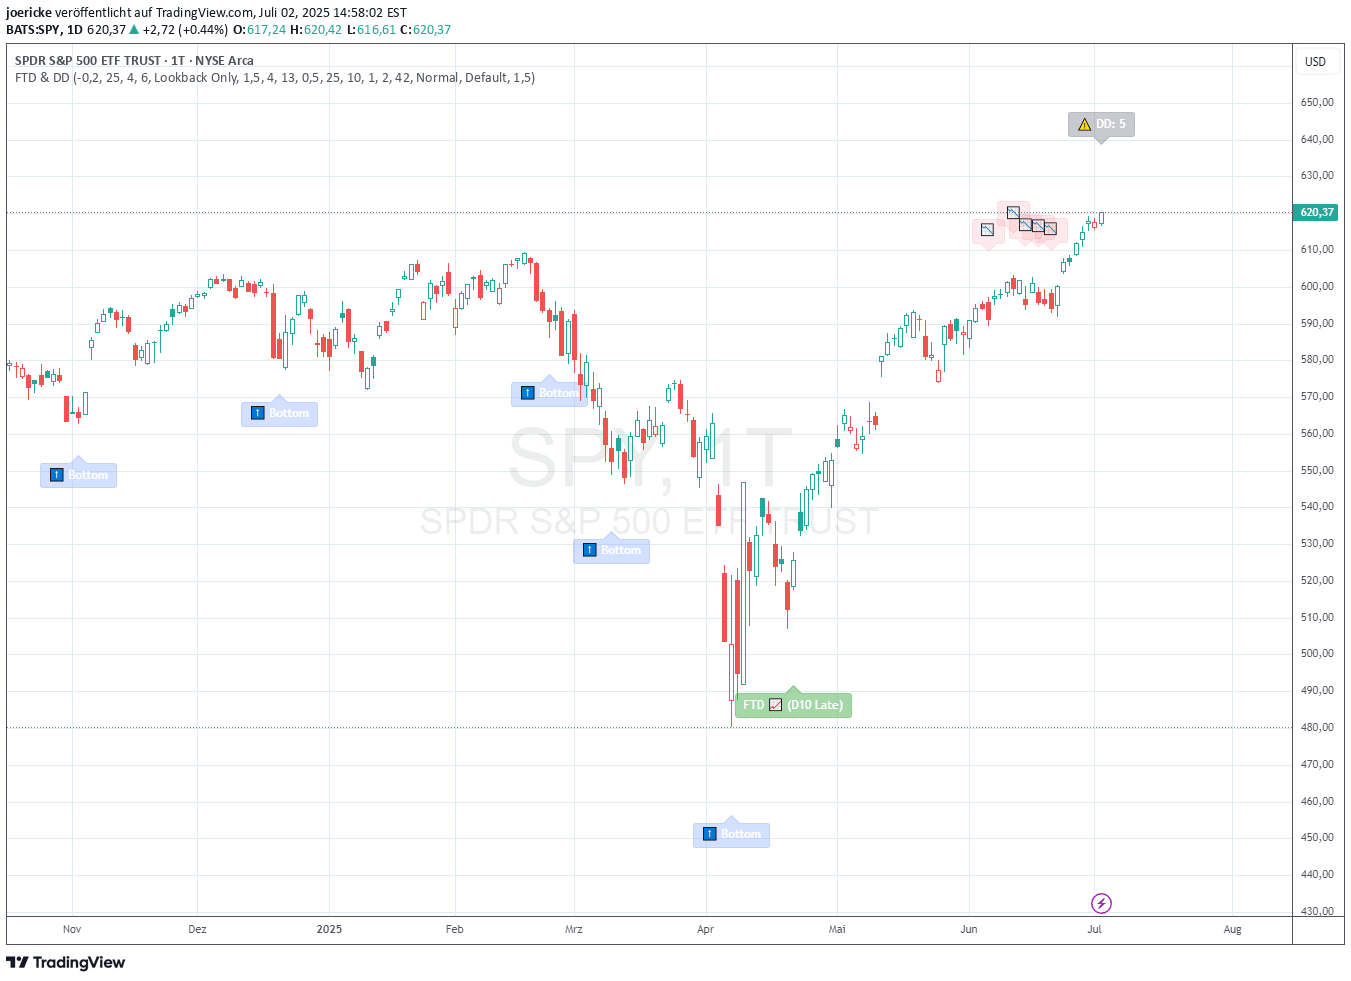
A tool that analyzes pinbar candles by counting the number of candles inside the wick and measuring the volume within the wick, providing insights into potential price movement.
Explore complementary indicator rolesHow it works
The Pinbar Analyzer calculates the total number of lower timeframe candles contained within a pinbar's wick, tracking their precise placement and distribution. It systematically counts each candle inside the wick, creating a comprehensive statistical representation of internal price action.
By simultaneously measuring the total volume within the wick, the tool provides traders with a nuanced understanding of potential price compression and potential breakout scenarios. This multi-dimensional analysis helps traders gauge the underlying market sentiment and potential directional momentum encapsulated within the pinbar formation.
Why it may be useful
The Pinbar Analyzer offers traders a sophisticated method of dissecting price action beyond traditional visual analysis, revealing hidden market dynamics within seemingly simple candlestick patterns. By quantifying candle count and volume inside the wick, traders gain deeper insights into potential market reversals and trend continuation signals.
This granular approach allows traders to make more informed decisions by understanding the internal structure of pinbar formations. The tool transforms subjective price action interpretation into a more objective, data-driven analysis that can enhance trading strategy precision and risk management.
When to explore it
The Pinbar Analyzer is most effective in volatile market conditions where price action becomes complex and multi-layered, particularly in shorter timeframes like scalping and day trading environments. Traders can utilize this tool when seeking to understand subtle market movements that might not be immediately apparent through traditional chart analysis.
It is particularly useful during periods of market uncertainty, such as around major economic news releases or during transitional market phases. Traders should apply this tool in conjunction with other technical indicators to validate potential trade setups and improve overall decision-making accuracy.
Keep exploring
What we’ve verified
Access, alerts and repainting behaviour have not been independently verified for this indicator. Check the creator’s current publication and settings.
General descriptions and classifications are recovered research. Verified details above identify the specific checks we have completed. Check the creator’s current publication for later changes.