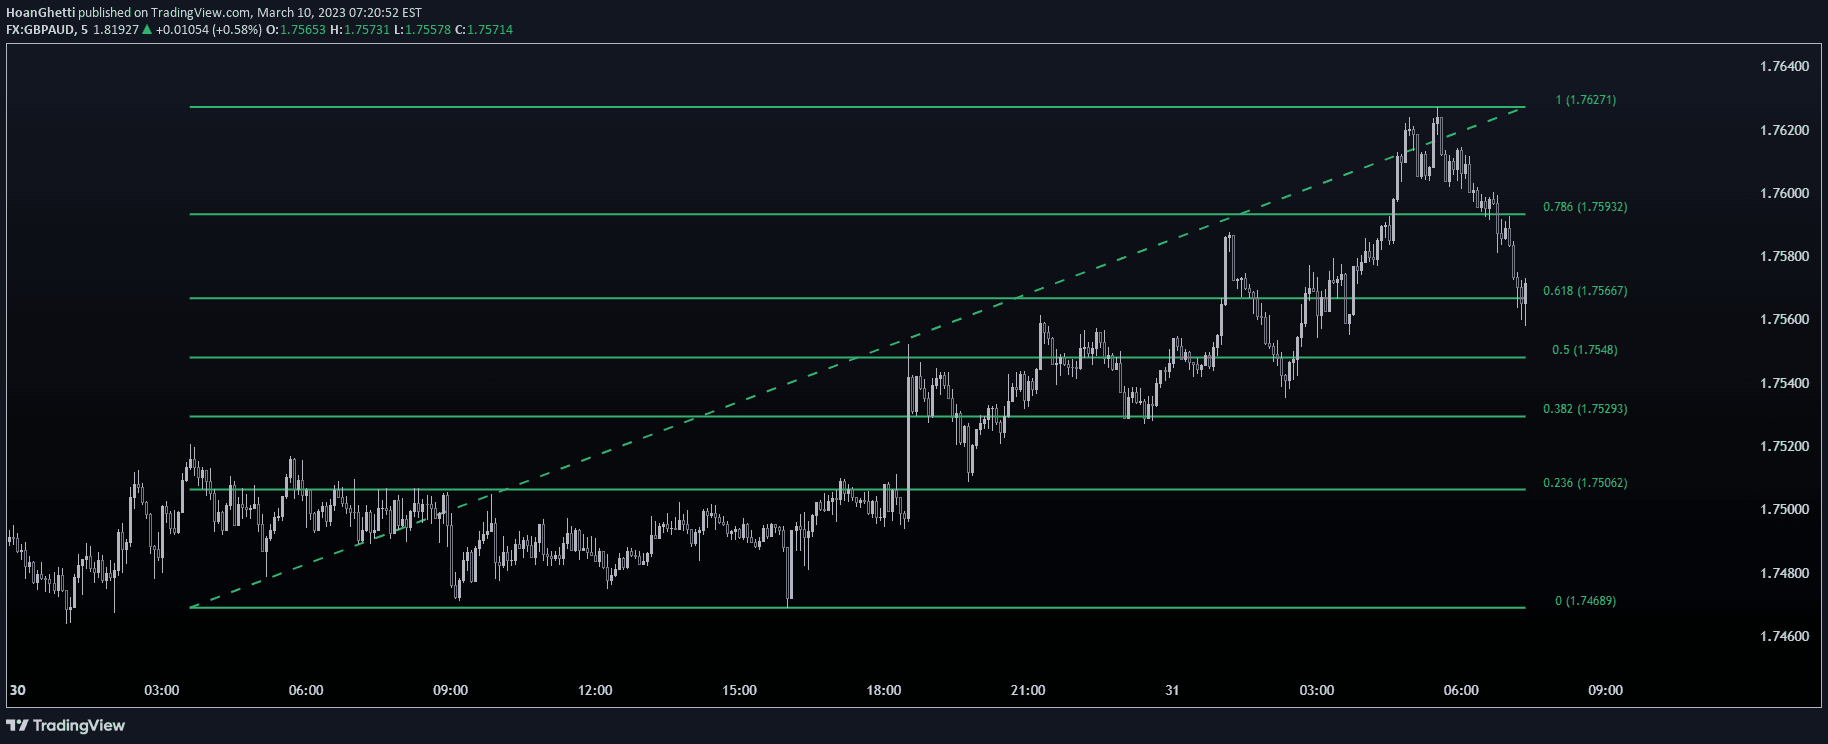
A Fibonacci retracement tool that identifies potential support and resistance levels by calculating key percentage levels between a low and high point of the past 14 candles.
Explore complementary indicator rolesHow it works
The Fibonacci retracement indicator starts by identifying the lowest and highest price points of the past 14 candles, creating a baseline for measurement. It then calculates specific retracement levels at 23.6%, 38.2%, 50%, 61.8%, and 76.4% between these points, creating horizontal lines across the price chart.
These percentage levels are derived from the Fibonacci sequence, a mathematical pattern found in nature and financial markets. The lines are drawn automatically, providing traders with visual reference points where price might potentially reverse or encounter support and resistance.
Why it may be useful
Fibonacci retracement levels offer traders valuable insights into potential price reversal points and market psychology during trend corrections. These levels help identify strategic entry and exit points, allowing traders to make more informed decisions about potential market movements.
By providing a systematic approach to identifying support and resistance zones, Fibonacci retracements help traders anticipate potential price behavior. The levels can be used across different markets and timeframes, making them a versatile tool for technical analysis and trading strategy development.
When to explore it
Fibonacci retracement works best during trending markets with clear directional movement, where price is likely to retrace before continuing its primary trend. Traders should look for these levels in conjunction with other technical indicators to confirm potential trading signals and increase the probability of successful trades.
The tool is particularly effective when combined with momentum indicators, volume analysis, and candlestick patterns. Traders should pay special attention to how price interacts with these levels, watching for potential bounces, rejections, or confirmations of the existing trend.
Keep exploring
What we’ve verified
Access, alerts and repainting behaviour have not been independently verified for this indicator. Check the creator’s current publication and settings.
General descriptions and classifications are recovered research. Verified details above identify the specific checks we have completed. Check the creator’s current publication for later changes.