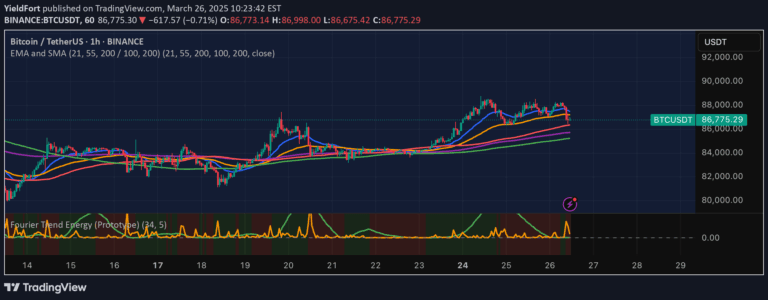
A mathematical approach to measuring price change using discrete finite differences, enabling more accurate derivative calculations for trading algorithms beyond simple point-to-point comparisons.
Explore complementary indicator rolesHow it works
Finite difference is a mathematical technique that calculates derivatives on discrete curves by examining neighboring points. Instead of using continuous mathematical functions, this method approximates rate of change by analyzing points before the current candle, specifically using a backwards difference approach.
By selecting different orders and accuracy levels, traders can customize how the derivative is calculated. The method allows for more nuanced analysis of price movement compared to simple point-to-point comparisons, providing a more sophisticated way of understanding price momentum and change.
Why it may be useful
Traditional derivative calculations often rely on continuous mathematical models, which don't translate well to real-world financial markets where data points are inherently discrete. This approach provides a more accurate representation of price movement by using weighted combinations of neighboring points to estimate rate of change.
By offering multiple levels of accuracy and order, traders can develop more sophisticated trading algorithms that go beyond basic price comparison. This method enables more precise understanding of price momentum, potentially revealing subtle market dynamics that simpler approaches might miss.
When to explore it
This approach is most effective when traders want a more sophisticated analysis of price momentum beyond simple point-to-point comparisons. It works particularly well for developing algorithmic trading strategies that require nuanced understanding of price change across different timeframes.
The method is especially useful for quantitative traders developing complex trading algorithms, researchers analyzing market dynamics, and traders seeking to understand subtle price movements. It provides a flexible framework for examining price changes with varying levels of mathematical precision.
Keep exploring
What we’ve verified
Access, alerts and repainting behaviour have not been independently verified for this indicator. Check the creator’s current publication and settings.
General descriptions and classifications are recovered research. Verified details above identify the specific checks we have completed. Check the creator’s current publication for later changes.