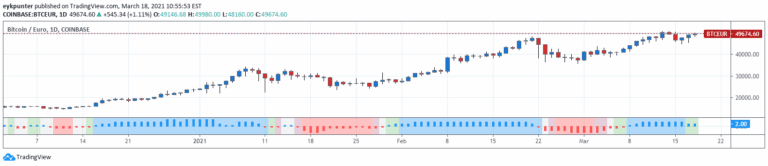
CM MACD Custom Indicator - Multiple Time Frame - V2
CM MACD Ultimate Multi-Timeframe V2 is an advanced MACD indicator with enhanced customization options, multi-timeframe analysis, and comprehensive trend visualization features.
Explore 11,183 indicators. Filter beyond the obvious.
Discover the tools that fit the way you trade.
11,183 tools to explore
CM MACD Ultimate Multi-Timeframe V2 is an advanced MACD indicator with enhanced customization options, multi-timeframe analysis, and comprehensive trend visualization features.
Volume Suite provides multiple volume-based indicators to analyze trading activity, including Volume Delta, CVD, Buy/Sell Volume, and Relative Volume for comprehensive market insights.
Range Sentiment Profile analyzes price variations within predefined price areas, highlighting bullish and bearish sentiment through color-coded profile bins across recent price ranges.
A cumulative volume delta indicator that analyzes intrabar volume to provide insights into market sentiment by tracking net buying and selling pressure across different time frames.
A unique indicator that compares buyers' demand and sellers' supply volumes to assess market sentiment through a graded faith scale represented by colored histogram staves.
The SMI MFI combines Stochastic Momentum Index and Money Flow Index to measure price momentum and buying/selling pressure, providing insights into market direction and strength.
A trading signal identifying significant price movement at market open caused by extraordinary news, using the opening gap as a potential trading target.
Advanced volume profile indicator that analyzes market order flow, helping traders understand buying and selling pressure across different timeframes using customizable visualization modes.
Volume Delta is an advanced indicator that analyzes trading volumes, revealing buy-sell activities and market momentum through color-coded candlestick visualizations.
MACD is a trend-following momentum indicator that reveals changes in price strength, direction, and duration by comparing two moving averages and their relationship.
A volume-based trading tool that identifies market imbalances by analyzing premium and discount zones, calculating delta volume to reveal potential price reversals and trend strength.
The Standardized SuperTrend Oscillator transforms the SuperTrend indicator into a dynamic tool for analyzing market trends, offering insights into potential reversals and mean reversion opportunities.
Likes, views, and comments are historical TradingView snapshots. They describe attention, not trading performance.