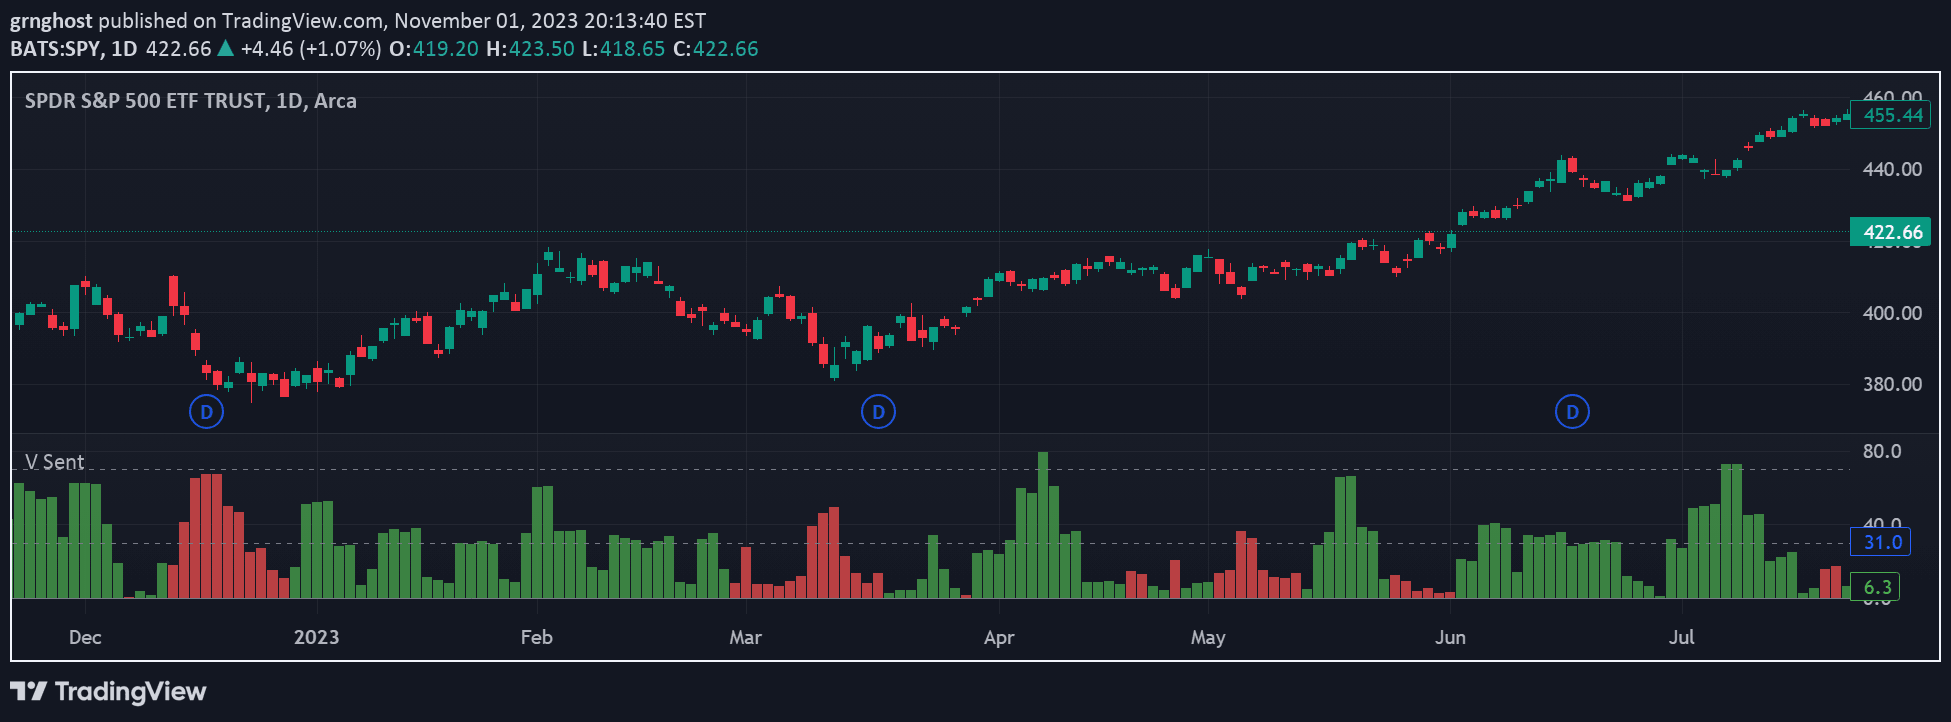
A trading signal that analyzes the relationship between price changes and trading volume relative to a stock's free float, helping traders understand liquidity-driven price movements.
Explore complementary indicator rolesHow it works
The Float Turnover Signal calculates the percentage change in closing price from two days ago to the previous day. It retrieves the stock's free float, which represents the number of publicly available shares, from TradingView.
The indicator then computes the turnover percentage by measuring the previous day's trading volume as a percentage of the free float. A turnover ratio is derived by dividing the price change percentage by the turnover percentage, which helps identify the relationship between price movement and trading volume.
Why it may be useful
The Float Turnover Signal provides traders with critical insights into the underlying dynamics of price movements by connecting volume and price changes. It helps traders understand whether price movements are driven by genuine market interest or potentially manipulated trading activity.
By offering color-coded signals that represent different turnover ratios, the indicator enables traders to quickly assess the stability and authenticity of price action. This can help in making more informed trading decisions and identifying potential breakouts or liquidity shifts.
When to explore it
The Float Turnover Signal is most effective in markets with significant liquidity and for stocks with substantial trading volume. It works best when traders want to understand the relationship between price changes and trading activity, particularly during periods of potential trend formation or reversal.
Traders can utilize this signal across different timeframes, making it versatile for various trading strategies. It is particularly useful for identifying volume-driven moves, confirming price action validity, and spotting potential breakouts or significant liquidity shifts in the market.
Keep exploring
What we’ve verified
Access, alerts and repainting behaviour have not been independently verified for this indicator. Check the creator’s current publication and settings.
General descriptions and classifications are recovered research. Verified details above identify the specific checks we have completed. Check the creator’s current publication for later changes.