
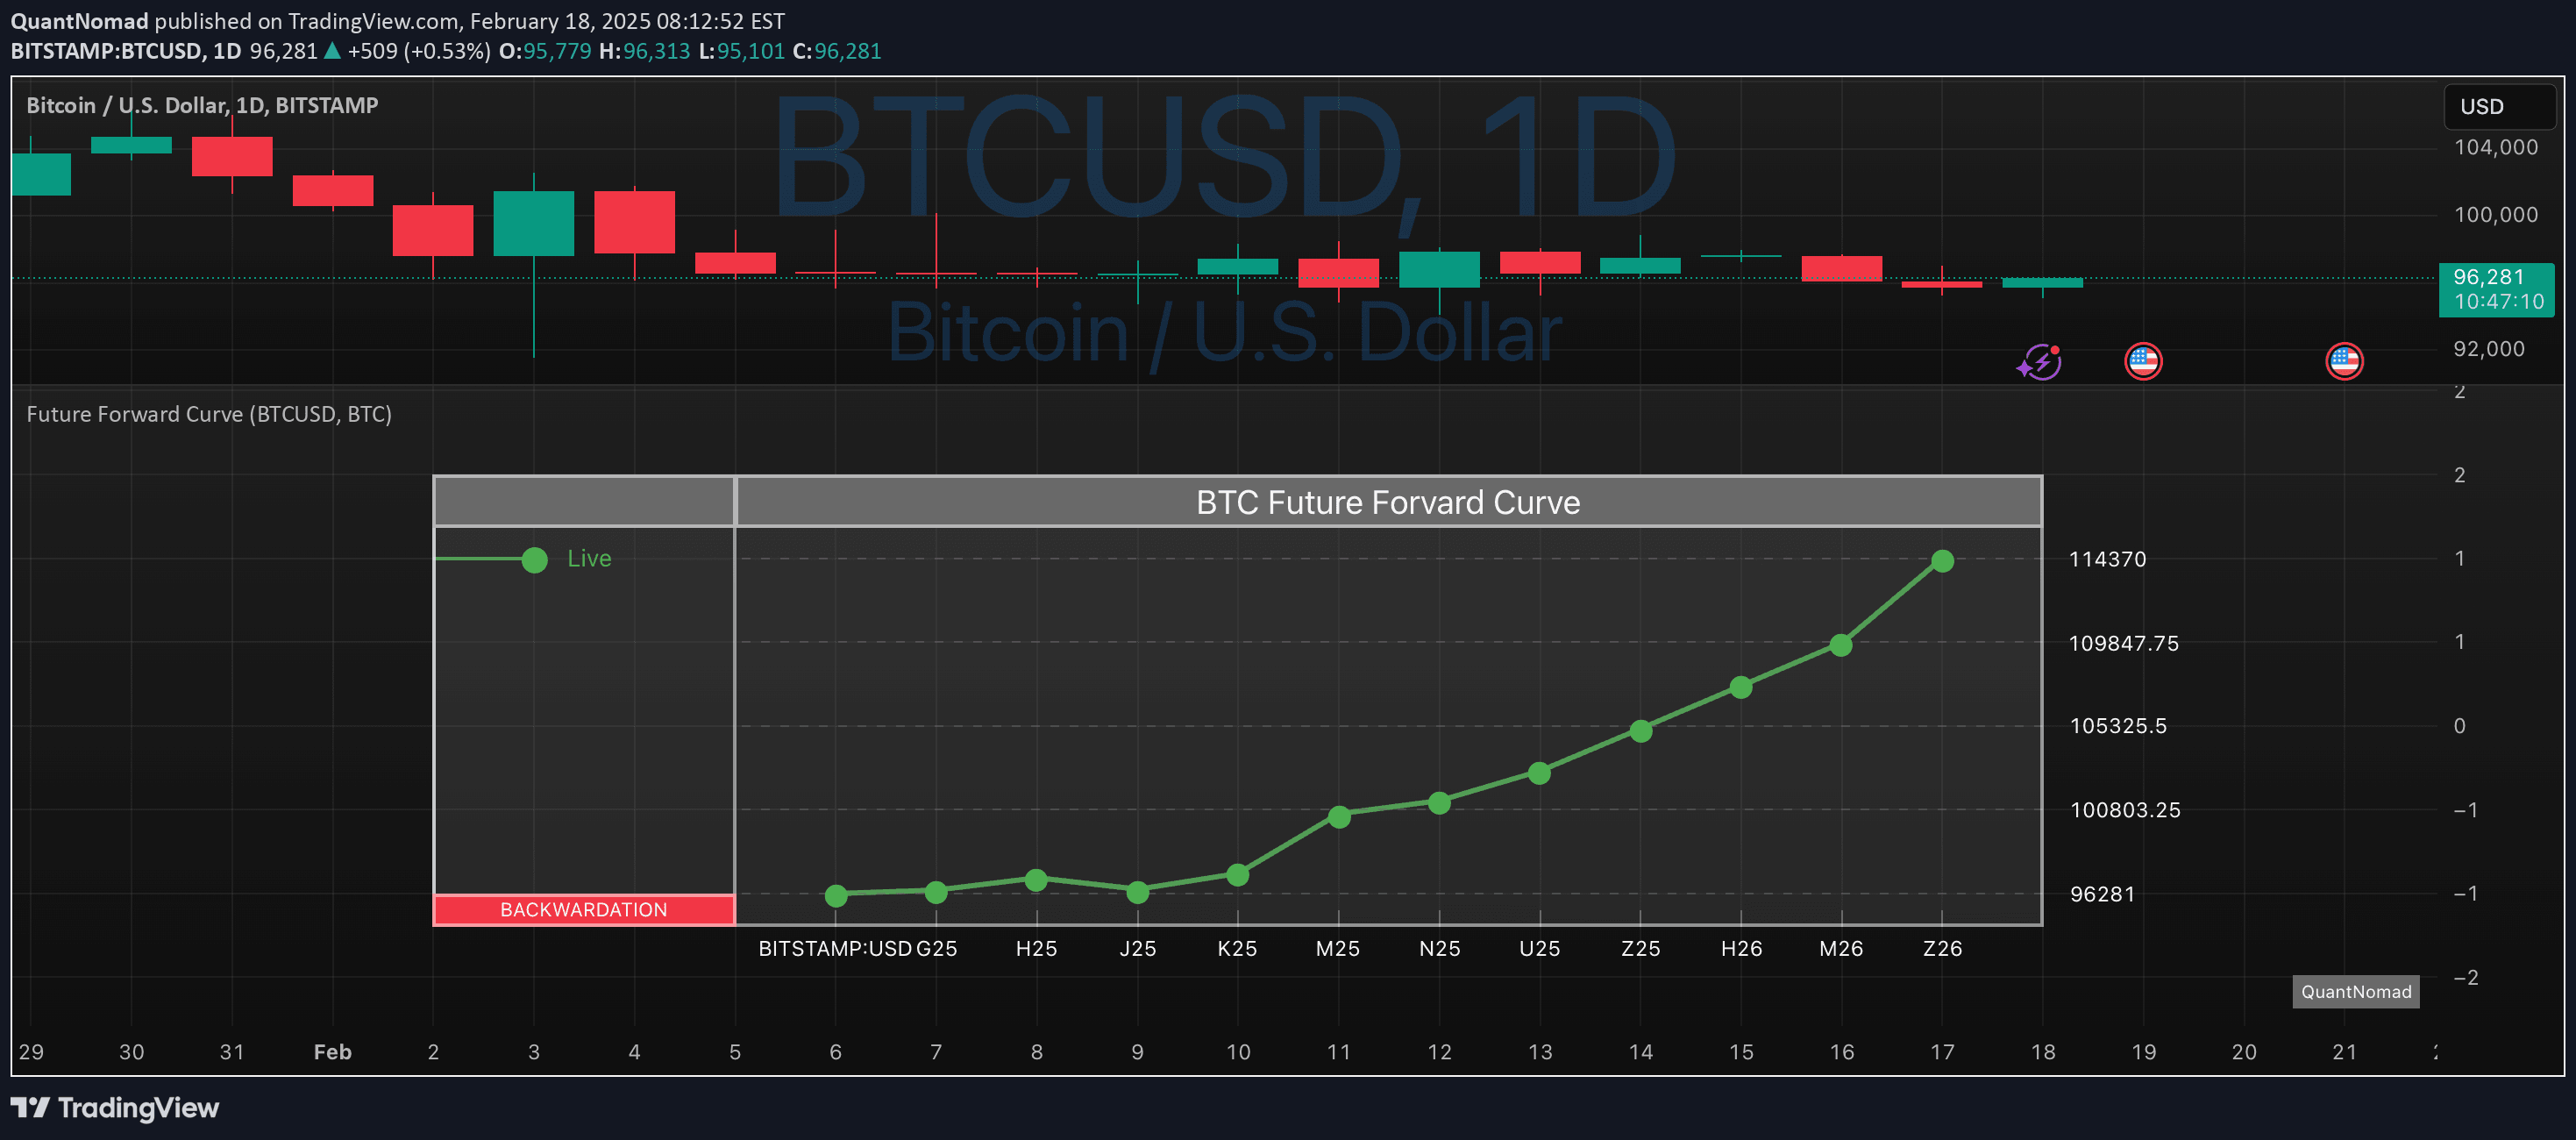
An advanced futures trading script that scans and visualizes the forward curve across multiple contracts, detecting market conditions like contango and backwardation in real-time.
Explore complementary indicator rolesHow it works
The script automatically scans futures contracts by inputting a spot symbol and futures product root, generating a comprehensive live forward curve visualization. It systematically analyzes multiple contract months, comparing their pricing relationships to detect specific market conditions like contango or backwardation.
By mapping the price relationships between spot and subsequent futures contracts (F1, F2, F3), the tool provides traders with an intuitive real-time chart showing the market's forward pricing dynamics. The automated scanning eliminates manual contract searching, streamlining the analysis process for futures traders.
Why it may be useful
Understanding the forward curve is crucial for futures traders as it reveals underlying market sentiment and potential pricing inefficiencies across different contract months. The script offers immediate insights into market structure, helping traders make more informed decisions about contract selection and potential trading opportunities.
By visualizing complex pricing relationships, traders can quickly identify whether the market is in contango (higher future prices) or backwardation (lower future prices), which can significantly impact trading strategies and potential arbitrage opportunities.
When to explore it
This script is most valuable during periods of market uncertainty or when trading commodities with complex futures markets like energy, agricultural, or metal contracts. Traders can leverage the tool when analyzing market trends, comparing contract pricing, or seeking to understand broader market dynamics.
It becomes particularly useful during market transitions, volatile periods, or when exploring potential spread trading opportunities across different contract months. Traders can use the visualization to quickly assess market conditions without manually comparing multiple contract prices.
Keep exploring
What we’ve verified
Access, alerts and repainting behaviour have not been independently verified for this indicator. Check the creator’s current publication and settings.
General descriptions and classifications are recovered research. Verified details above identify the specific checks we have completed. Check the creator’s current publication for later changes.


