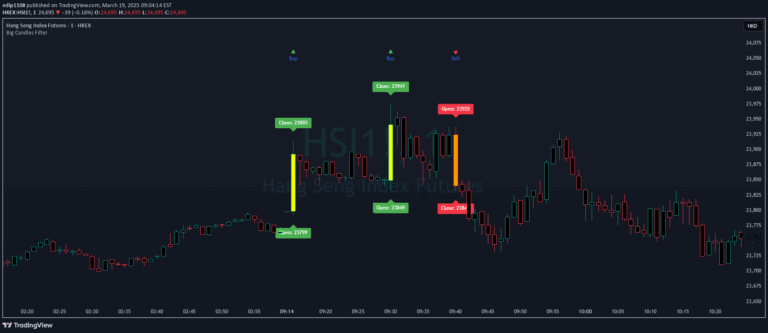
A custom candle indicator using Hull Moving Average (HMA) to reduce market noise and help identify price trends by calculating unique open, high, low, and close values.
Explore complementary indicator rolesHow it works
The indicator calculates open, high, low, and close prices using a Hull Moving Average with a default period of 10. It determines candle colors by comparing the current HMA-based OHLC4 value with the previous candle's value.
Green candles indicate an increasing trend, while red candles suggest a decreasing or stagnant trend. The current price is plotted using a single-period SMA to provide flexibility in trend identification and potential smoothing
Why it may be useful
This custom candle indicator helps traders reduce market noise and better visualize price trends. By using HMA calculations, it provides a smoother representation of price movement compared to traditional candlestick charts.
The color-coded candles make it easier to quickly assess market direction and momentum. The flexible SMA overlay allows traders to customize their view and potentially identify trend changes more effectively
When to explore it
This indicator works best in markets with clear trending behavior, such as forex, cryptocurrencies, and stocks with consistent directional movements. It is particularly useful for swing and day traders looking to minimize noise and gain a clearer perspective on price trends. Traders should combine this indicator with other technical analysis tools to confirm signals and make more informed trading decisions
Keep exploring
What we’ve verified
Access, alerts and repainting behaviour have not been independently verified for this indicator. Check the creator’s current publication and settings.
General descriptions and classifications are recovered research. Verified details above identify the specific checks we have completed. Check the creator’s current publication for later changes.