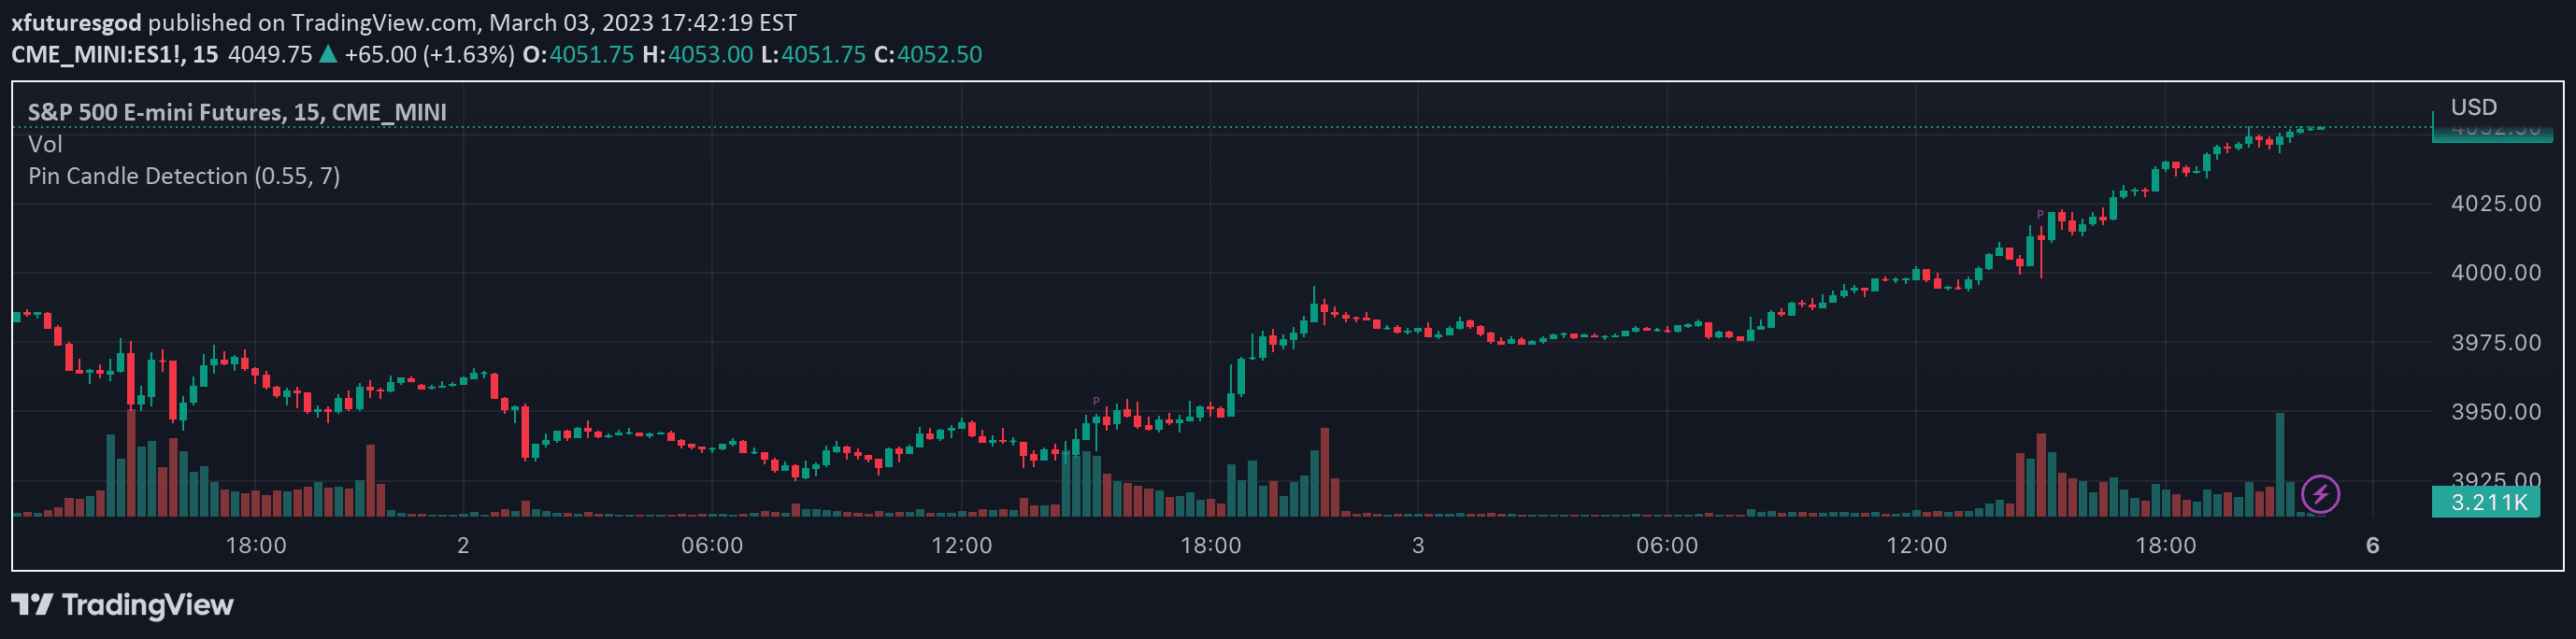
An Indecisive Candle reveals market uncertainty, showing a balance between buyers and sellers with small bodies and long wicks, indicating potential consolidation or trend reversal.
Explore complementary indicator rolesHow it works
Indecisive Candles are identified by calculating the relationship between a candle's body and total price range. If the body is less than or equal to 50% of the total candle range, it qualifies as an indecisive candle. The small body indicates minimal price movement between open and close, while long upper and lower wicks demonstrate that both buyers and sellers attempted to control price but ultimately failed.
These candles serve as critical markers of market sentiment, revealing moments of equilibrium between bullish and bearish forces. By analyzing the context of their formation - such as their position after a strong trend or within a consolidation phase - traders can gain insights into potential market reversals or continuation patterns.
Why it may be useful
Indecisive Candles provide valuable insights into market psychology, helping traders understand moments of institutional supply and demand. They reveal critical points where large market participants might be entering or exiting positions, offering a window into potential future price movements. These candles can signal important turning points in market trends, allowing traders to anticipate potential reversals or continuations.
By highlighting periods of market uncertainty, these candles help traders make more informed decisions about entry and exit points. They are particularly useful for identifying key support and resistance levels, understanding market sentiment, and developing more strategic trading approaches that align with institutional trading behavior.
When to explore it
Indecisive Candles are most effective when used in conjunction with other technical analysis tools and within specific market contexts. They are particularly valuable after strong trending periods, where they can indicate potential trend reversals or consolidation zones. Traders should look for these candles at key support and resistance levels, as they often represent critical decision points for market participants.
The most reliable signals occur when these candles appear in confluence with other technical indicators, volume analysis, and broader market context. Traders should use them as part of a comprehensive trading strategy, combining their insights with additional confirmation from subsequent price action, volume spikes, or other technical analysis tools.
Keep exploring
What we’ve verified
Access, alerts and repainting behaviour have not been independently verified for this indicator. Check the creator’s current publication and settings.
General descriptions and classifications are recovered research. Verified details above identify the specific checks we have completed. Check the creator’s current publication for later changes.