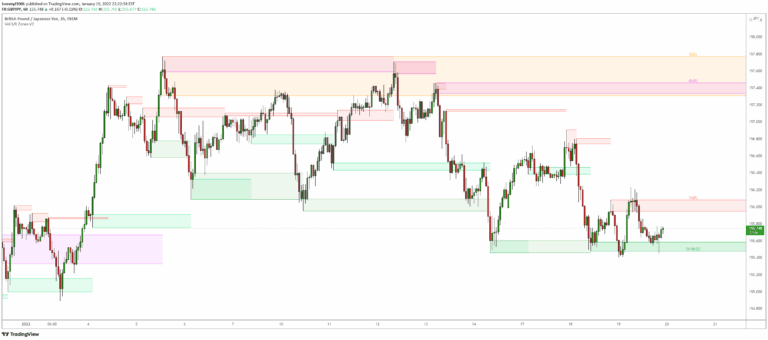
Volume-based Support & Resistance Zones
An advanced Support & Resistance indicator that identifies significant price zones using volume and fractal highs/lows, helping traders visualize potential trend reversals and continuations.
Explore 11,183 indicators. Filter beyond the obvious.
Discover the tools that fit the way you trade.
11,183 tools to explore
An advanced Support & Resistance indicator that identifies significant price zones using volume and fractal highs/lows, helping traders visualize potential trend reversals and continuations.
A custom ZigZag indicator that identifies market reversals using momentum indicators, providing true pivot points without repainting and highlighting impulse strength.
AlphaTrend is a dynamic trend-following indicator that uses Money Flow Index or RSI to generate buy and sell signals based on trend direction and momentum crossovers.
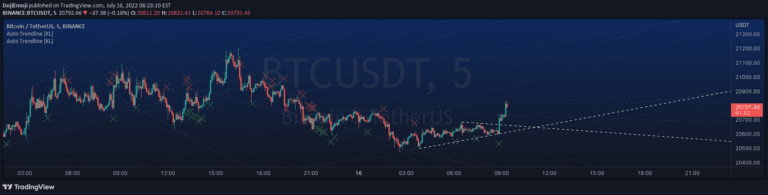
An automated tool that systematically draws trend lines by connecting recent fractals, helping traders identify potential price action patterns without subjective manual drawing.
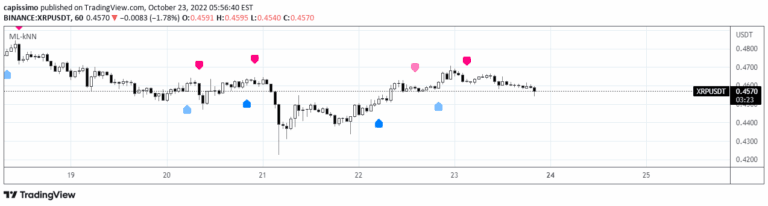
A k-Nearest Neighbours machine learning strategy that predicts market moves by analyzing historic data and finding similar past market conditions to forecast future price directions.
An advanced Ichimoku Kinko Hyo indicator with extensive customization options for analyzing market trends, momentum, and potential trading signals across different timeframes.
A multi-level moving average strategy that identifies trend strength by analyzing recursive moving averages across multiple levels, providing insights into market trend direction and potential reversals.
Ichimoku Oscillator is a multi-layered technical analysis tool that evaluates market trends using Ichimoku Cloud features, providing insights into potential entry and exit points.
A statistical trailing stop tool that uses log-normal distribution of volatility to help traders lock in profits across different market conditions and trend strengths.
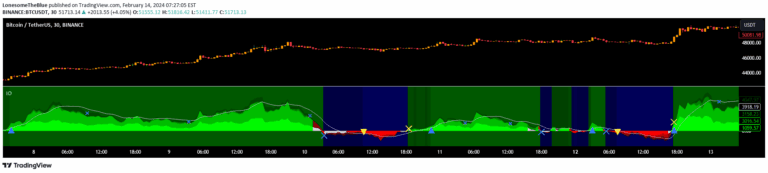
An advanced Ichimoku-based oscillator that provides comprehensive market trend analysis by converting complex cloud components into a streamlined, color-coded momentum indicator.
A trend-following trading signal that uses harmonic patterns to identify bullish and bearish zones by analyzing price movement across five confirmed pivot points.
A comprehensive TradingView script that mimics MarketSmith charts, offering customizable moving averages, RS Rating, and high/low point detection for technical analysis.
Likes, views, and comments are historical TradingView snapshots. They describe attention, not trading performance.