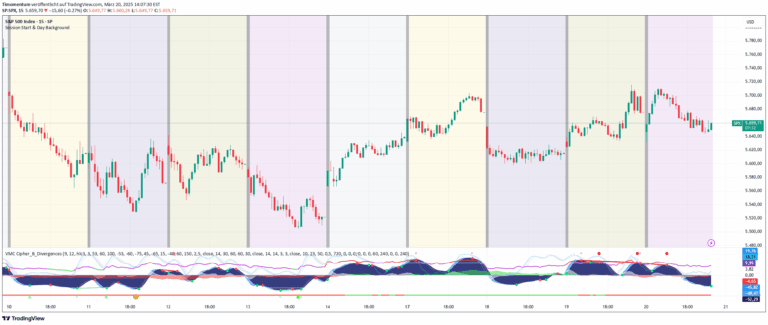
A trading session indicator for Indian stock markets that highlights volatility variations throughout the trading day, helping traders understand market dynamics and optimize strategy timing.
Explore complementary indicator rolesHow it works
This indicator divides the Indian stock market trading day into three distinct sessions with color-coded segments. The morning session from 9:15 am to 10:30 am is marked in saffron and represents high volatility, indicating potential significant price movements.
The middle session from 10:35 am to 2:25 pm is marked in white and represents lower volatility, suggesting more stable trading conditions. The closing session from 2:30 pm to 3:30 pm is marked in green and indicates medium to high volatility, which could present additional trading opportunities.
Why it may be useful
Understanding market session volatility helps traders make more informed decisions about trade entry and exit points. By recognizing how market dynamics change throughout the day, traders can adjust their strategies to match the current market conditions and potential price movements.
This indicator provides visual cues that can help traders anticipate potential market behavior, manage risk more effectively, and align their trading approach with the specific characteristics of each market session.
When to explore it
This indicator is most useful for day traders and scalpers operating in the Indian stock markets who want to optimize their trading strategies. Traders can use the session information to plan their trades, focusing on high-volatility periods for potential momentum and quick profit opportunities.
By marking different sessions with distinct colors, traders can quickly identify the most suitable times for their specific trading strategies, whether they are looking for high-impact moments or more stable trading windows.
Keep exploring
What we’ve verified
Access, alerts and repainting behaviour have not been independently verified for this indicator. Check the creator’s current publication and settings.
General descriptions and classifications are recovered research. Verified details above identify the specific checks we have completed. Check the creator’s current publication for later changes.