YOUR INDICATOR RESEARCH STARTS HERE

Find the right indicator.
Understand what it does.

Explore 11,183 indicators. Filter beyond the obvious.
Discover the tools that fit the way you trade.

THE INDICATOR LIBRARY

Results for “nse”

11,183 tools to explore

101 indicators matching your filters
Save search
VolumeTrendEditor’s pick

#NAME?

by ClassicScott

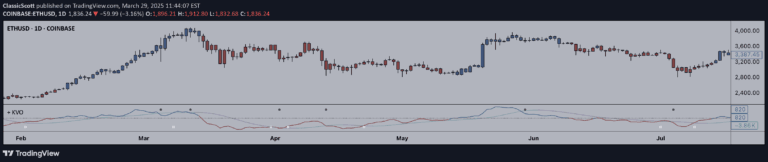
The Klinger Oscillator is a volume-based technical indicator that compares price changes and volume to determine potential trend reversals and market momentum.

Separate pane · unverifiedDay Trading · Swing Trading
Explore
1.9Klikes62.3Kviews40comments
Save
VolumeTrendEditor’s pick

Enhanced Time Segmented Volume

by StephXAGs

Time Segmented Volume is a leading indicator that measures money flow in and out of a financial instrument by analyzing price and volume segments to predict potential trend directions.

Separate pane · unverifiedDay Trading · Swing Trading
Explore
1.3Klikes39.1Kviews27comments
Save
LevelsSignalVolatility

ICT Asian Range and Killzones

by ICTFusion

A trading session indicator that highlights key market windows like Asian Range and London/New York Killzones, providing visual insights into potential trading ranges and market activity levels.

Main price chart · unverifiedScalping · Day Trading
Explore
964likes21.8Kviews4comments
Save
SignalLevels

Liquidity stop hunt

by Spunsen

A technical tool that identifies potential liquidity zones and stop hunt areas by detecting swing highs/lows and marking key price levels where fakeouts are likely to occur.

Main price chart · unverifiedScalping · Day Trading
Explore
956likes11.6Kviews6comments
Save
SignalTrend

NSE Option Chain

by KapoorChandra

An options dashboard displaying real-time call and put strike prices across 16 strikes, helping traders analyze market sentiment and potential trend direction through options data visualization.

Separate pane · unverifiedScalping · Day Trading
Explore
883likes22.5Kviews37comments
Save
MomentumOscillatorSignal

YD_Divergence_RSI+CMF

by Yonsei_dent

A divergence indicator that combines RSI and CMF to identify potential trend reversals by comparing price movements with indicator performance across four distinct divergence scenarios.

Separate pane · unverifiedScalping · Day Trading
Explore
581likes9.6Kviews4comments
Save

Likes, views, and comments are historical TradingView snapshots. They describe attention, not trading performance.

START WITH A QUESTION

A little less searching.
A lot more understanding.

Tell DeepAlpha what you need. Get an explanation, a shortlist,
and a direct path to the indicators behind it.

Ask DeepAlpha