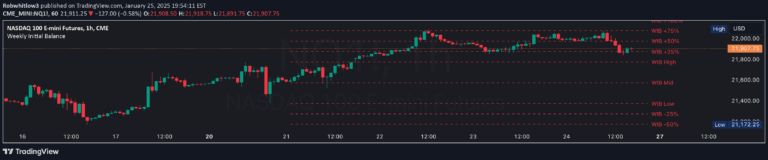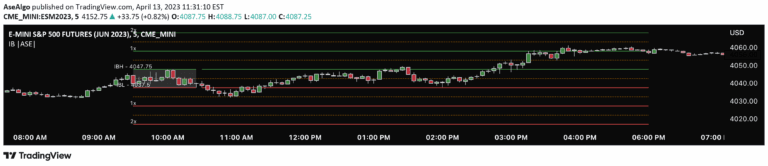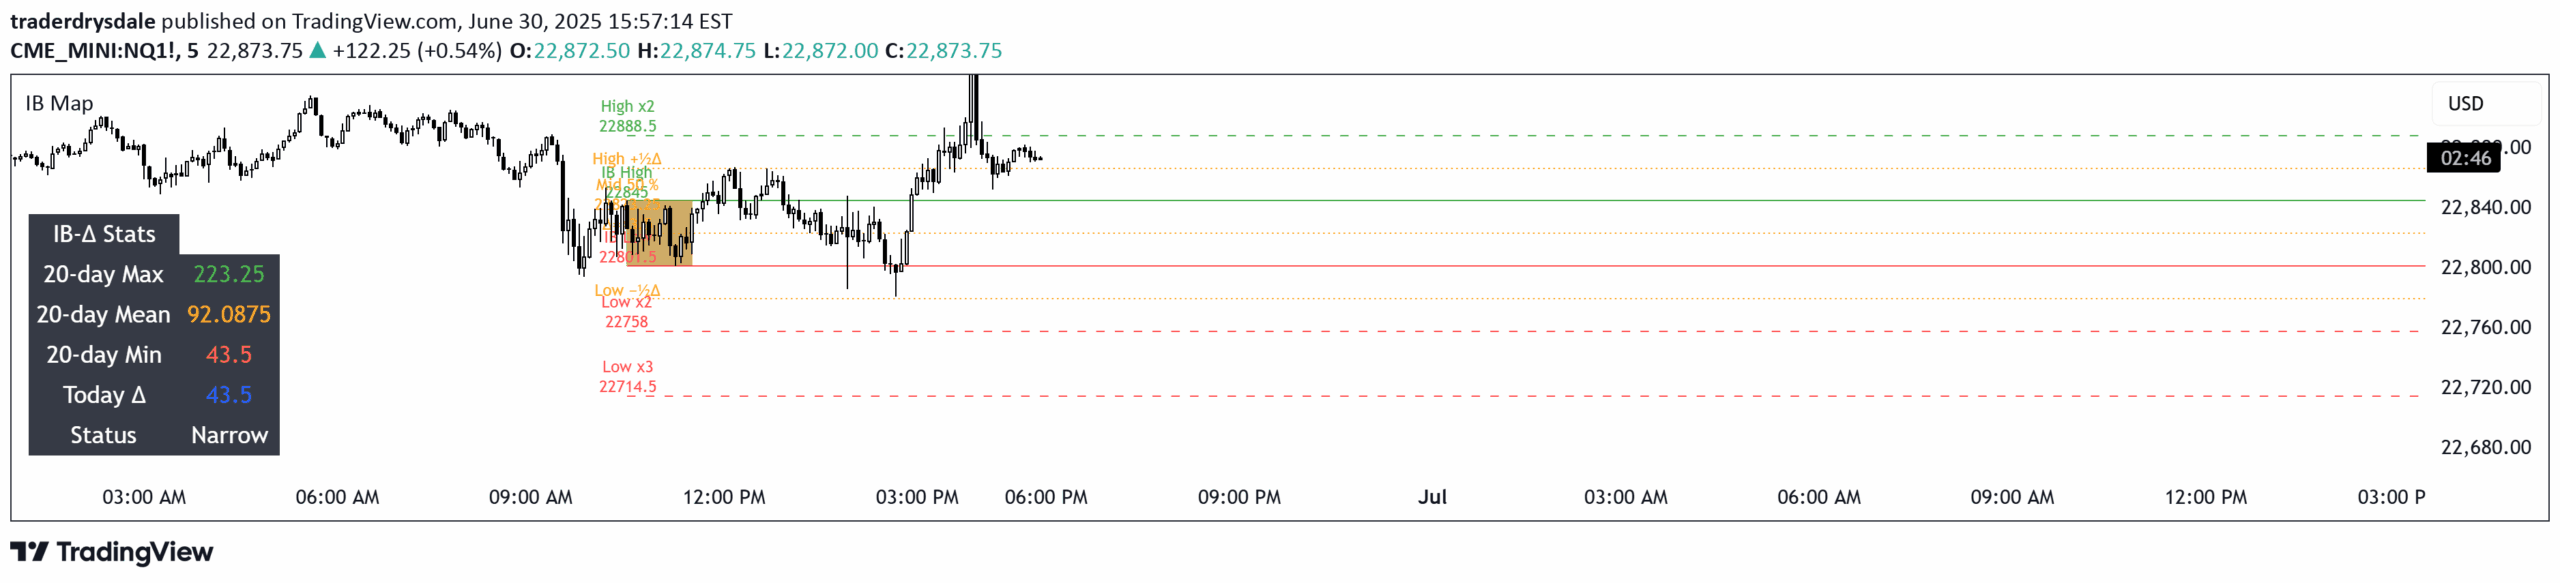
Initial Balance Pro is a precise trading indicator that analyzes market open dynamics, helping traders identify key price levels, breakout zones, and potential trading opportunities across different markets.
Explore complementary indicator rolesHow it works
The Initial Balance Pro indicator automatically calculates and plots the initial balance (IB) high and low during the market's opening period. Traders can customize the time range, typically between 30-60 minutes after market open. The indicator visually highlights breakout and rejection zones, helping traders understand early market sentiment.
It tracks the initial price action and provides key reference points for potential trade entries. The tool plots midpoint and extension levels to help anticipate price targets. By tracking these early market dynamics, traders can gain insights into potential price movements
Why it may be useful
Initial Balance Pro is crucial because it provides a structured approach to understanding market dynamics during the opening period. Institutional traders often set their positions within this initial range, making it a significant reference point for potential trend continuation or reversal.
The indicator helps traders identify high-probability trade opportunities by revealing key support and resistance levels. It offers a systematic method to analyze early market sentiment and potential price direction. By combining this tool with volume and order flow analysis, traders can make more informed trading decisions
When to explore it
Initial Balance Pro works best during the first 30-60 minutes of market trading across futures, forex, equity, and options markets. It is particularly effective for traders focused on intraday strategies and price action analysis. The indicator is most valuable when markets are most active and liquidity is high.
Traders can use it to identify potential breakout or mean-reversion opportunities. It is especially useful for those looking to capitalize on early market movements and institutional trading patterns. The tool provides clear visual cues for potential trade entries and exits
Keep exploring
What we’ve verified
Access, alerts and repainting behaviour have not been independently verified for this indicator. Check the creator’s current publication and settings.
General descriptions and classifications are recovered research. Verified details above identify the specific checks we have completed. Check the creator’s current publication for later changes.