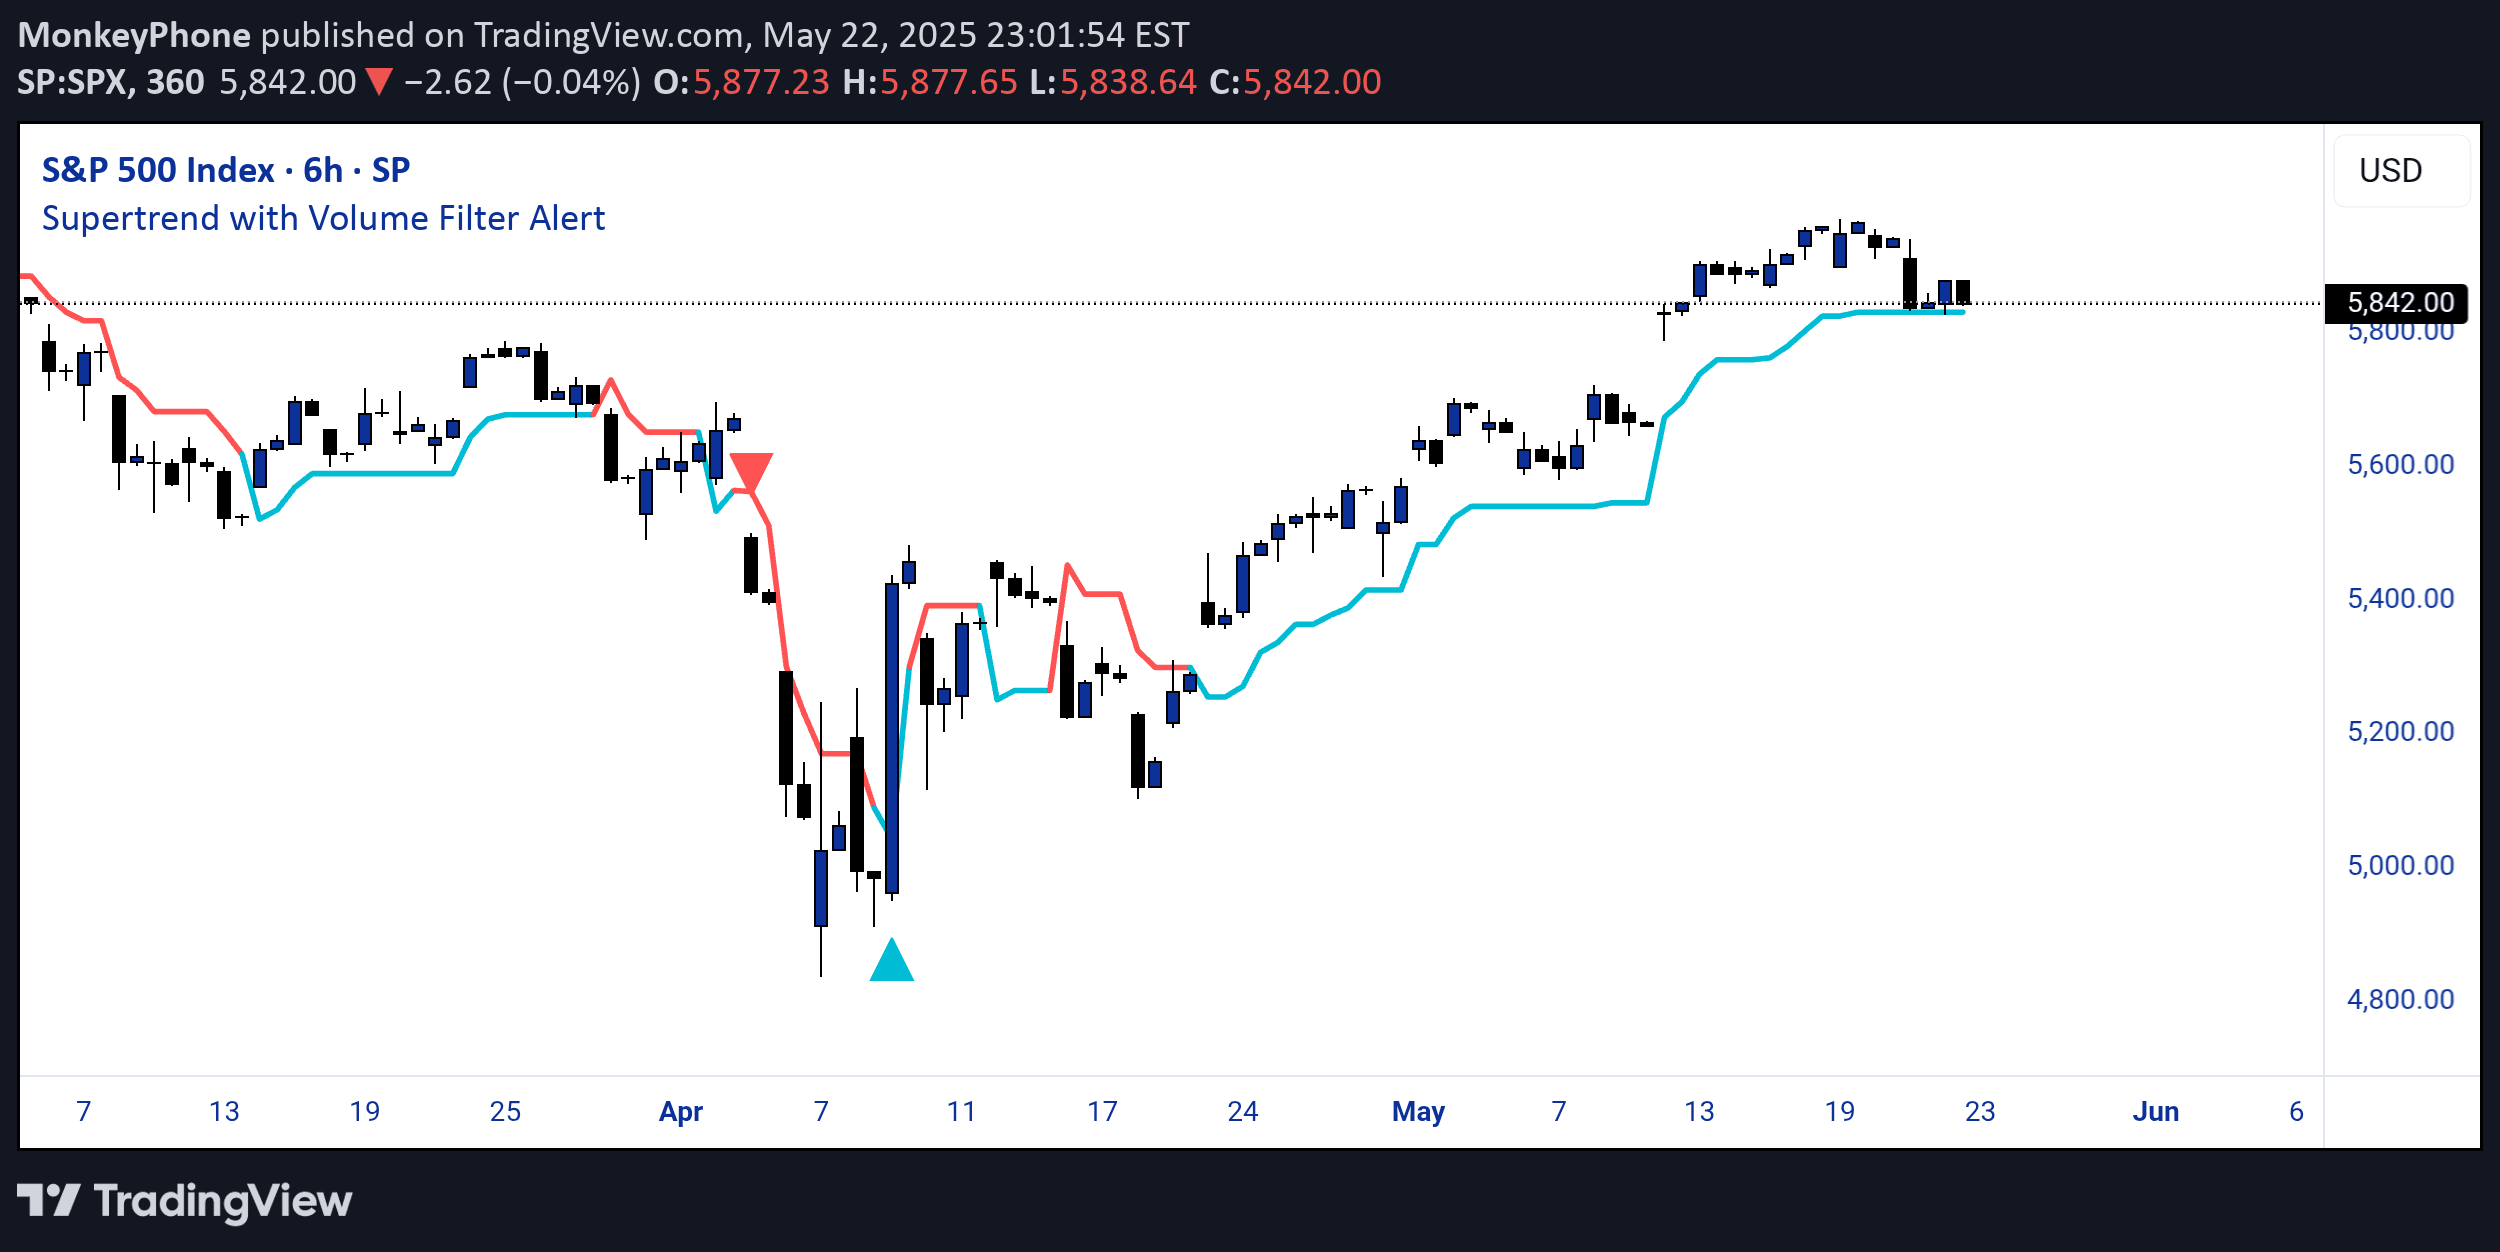
A volume analysis indicator that identifies buying and selling pressures by examining volume changes, price movements, and exponential moving averages to highlight potential market trends.
Explore complementary indicator rolesHow it works
The volume analysis signal operates by tracking volume and price changes in conjunction with dual exponential moving averages (EMAs). It creates specific conditions for identifying buying and selling pressures, focusing on the relationship between current volume and its moving averages.
When volume rises and price increases or decreases, the indicator checks if the current volume is above both fast and slow EMAs. The relative positions of these EMAs help confirm potential market momentum, with the fast EMA's position relative to the slow EMA providing additional confirmation of the signal's strength.
Why it may be useful
Volume analysis provides traders with critical insights into market sentiment and potential price movements by revealing the underlying strength of price trends. By examining volume in relation to price changes, traders can better understand whether a price movement is likely to continue or potentially reverse.
This indicator helps traders make more informed decisions by offering visual cues about market dynamics, such as distinguishing between genuine trend movements and potential false signals. Its color-coded approach allows quick identification of buying and selling pressures, making it a valuable tool for understanding market psychology.
When to explore it
The volume analysis signal is most effective in markets with clear trending characteristics and substantial trading volume. It works best in liquid markets where volume can provide meaningful insights into price movements and trader sentiment.
Traders should use this indicator in conjunction with other technical analysis tools to confirm signals and reduce the likelihood of false positives. It is particularly useful during periods of significant market activity, such as during news events, earnings releases, or when trading major financial instruments with high liquidity.
Keep exploring
What we’ve verified
Access, alerts and repainting behaviour have not been independently verified for this indicator. Check the creator’s current publication and settings.
General descriptions and classifications are recovered research. Verified details above identify the specific checks we have completed. Check the creator’s current publication for later changes.